The fund underperformed the indices in December, with no overall reason. A few issues underperformed, e.g. GWO.PR.I, -2.18%; HSE.PR.C, -5.43%; and TRP.PR.F, -1.80%.
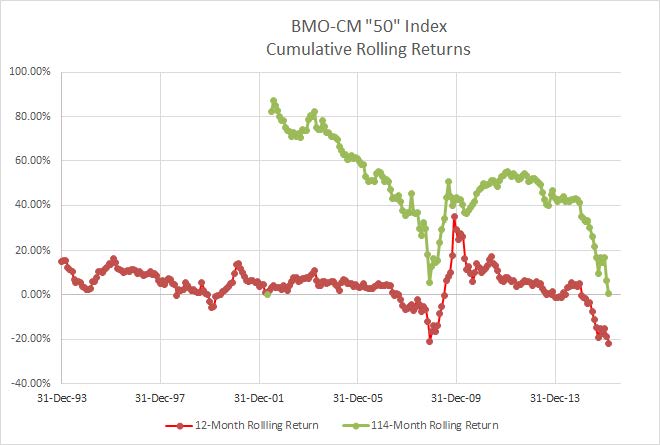
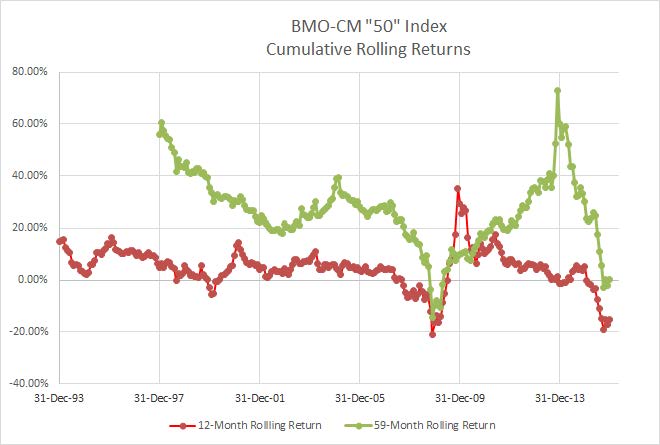
When I wrote eMail To A Client towards the end of July, one had to go back to January, 2011, to find a starting point that would give you a positive return through the holding period. As of the end of September, the required starting point moved back again, to July month-end, 2010. Readers will be happy to learn that, according to the BMO-CM “50” index, one again sees slightly positive returns for the period January, 2011, to December 2015. We can also say that returns have been positive since September 2015, but that’s just a blip that few will consider meaningful!
The current 59-month total cumulative return of basically zero was only exceeded during the Credit Crunch – and even then, the figure was only negative for seven months, from October 2008 to April 2009 inclusive. The discussion in eMail To A Client still applies … but more so, now!
 Click for Big
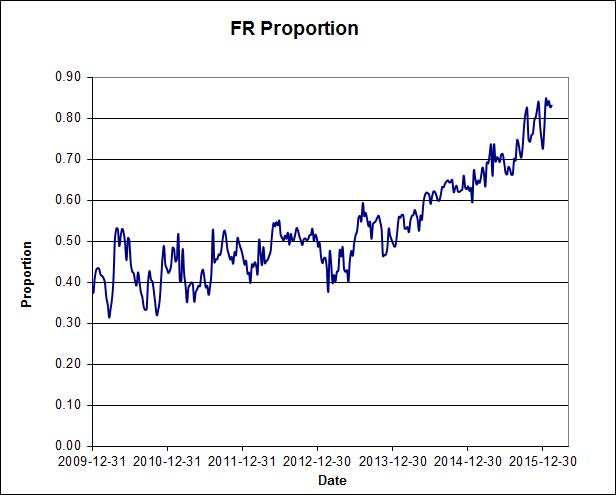
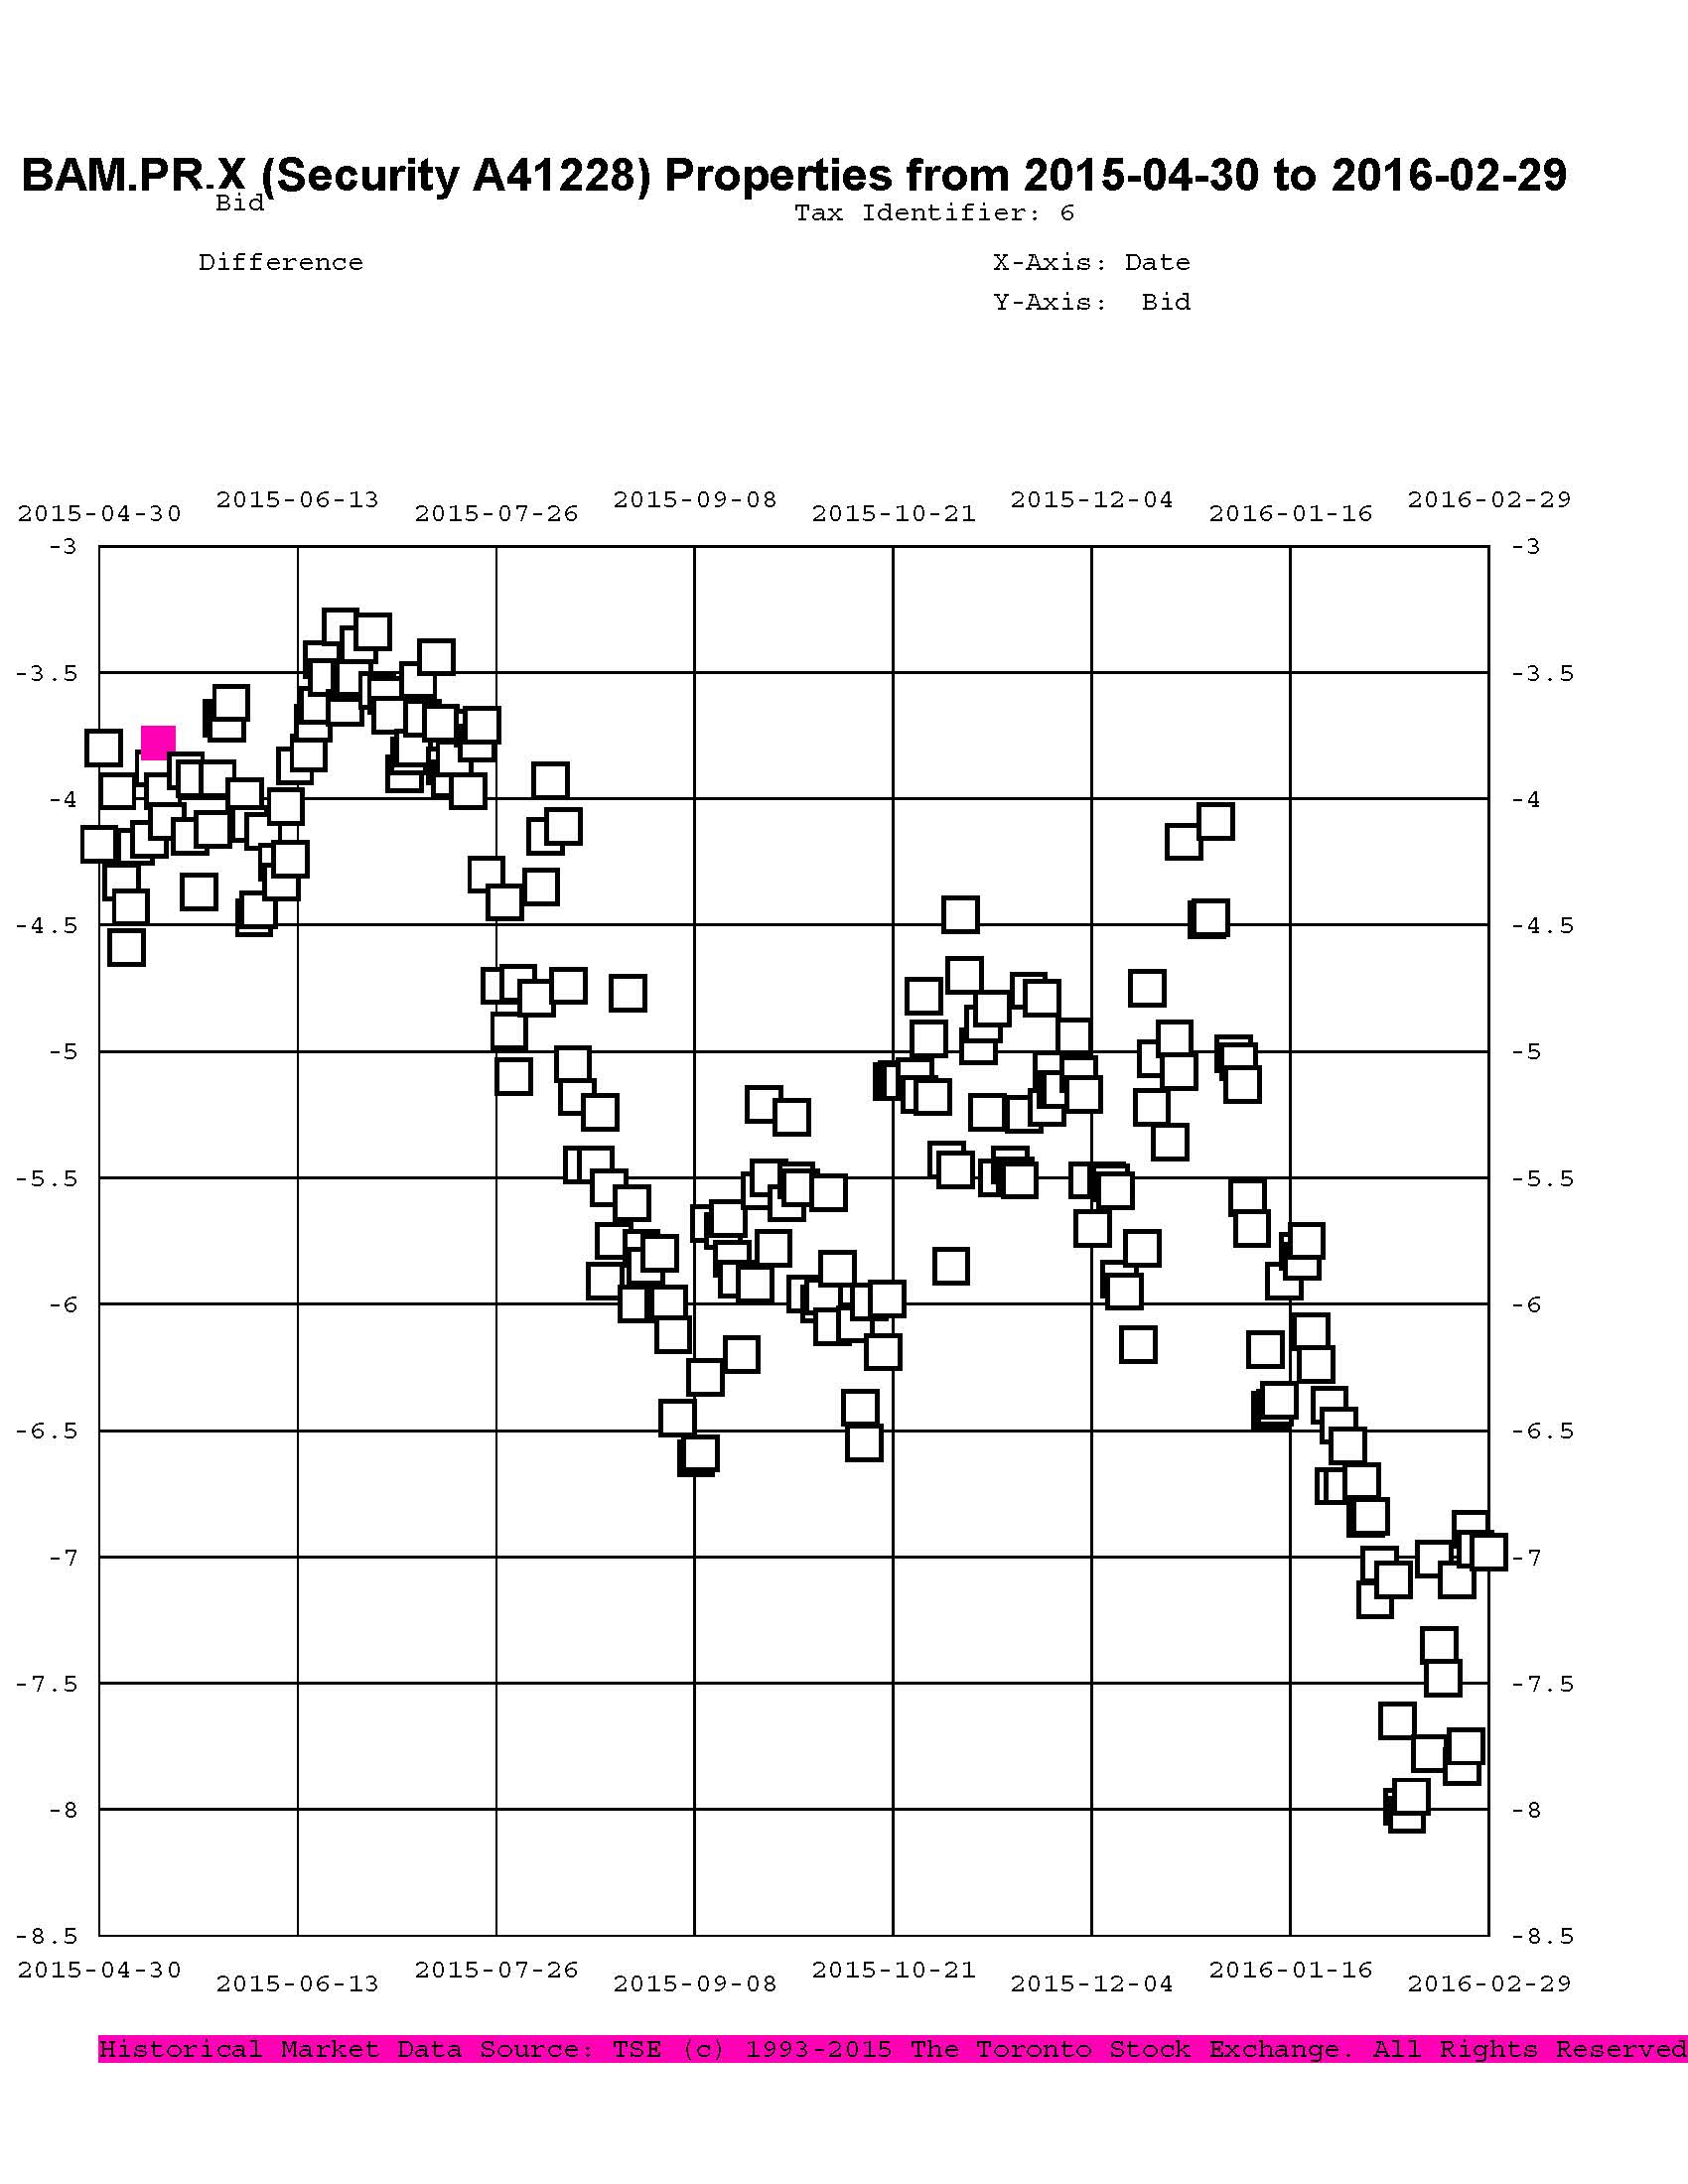
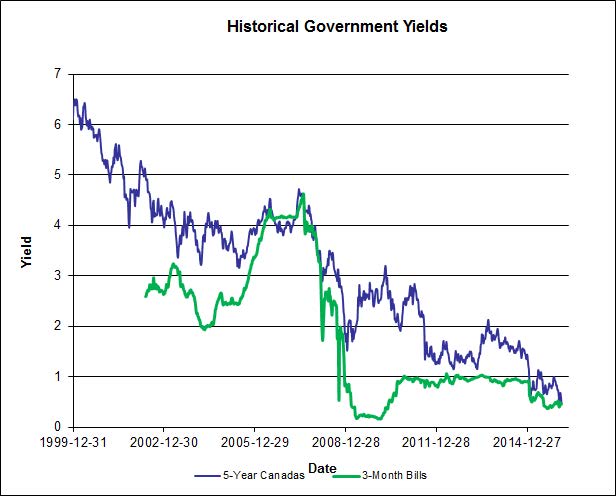
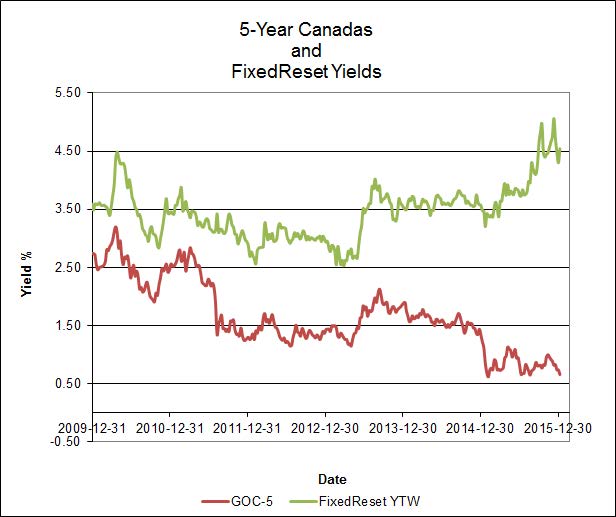
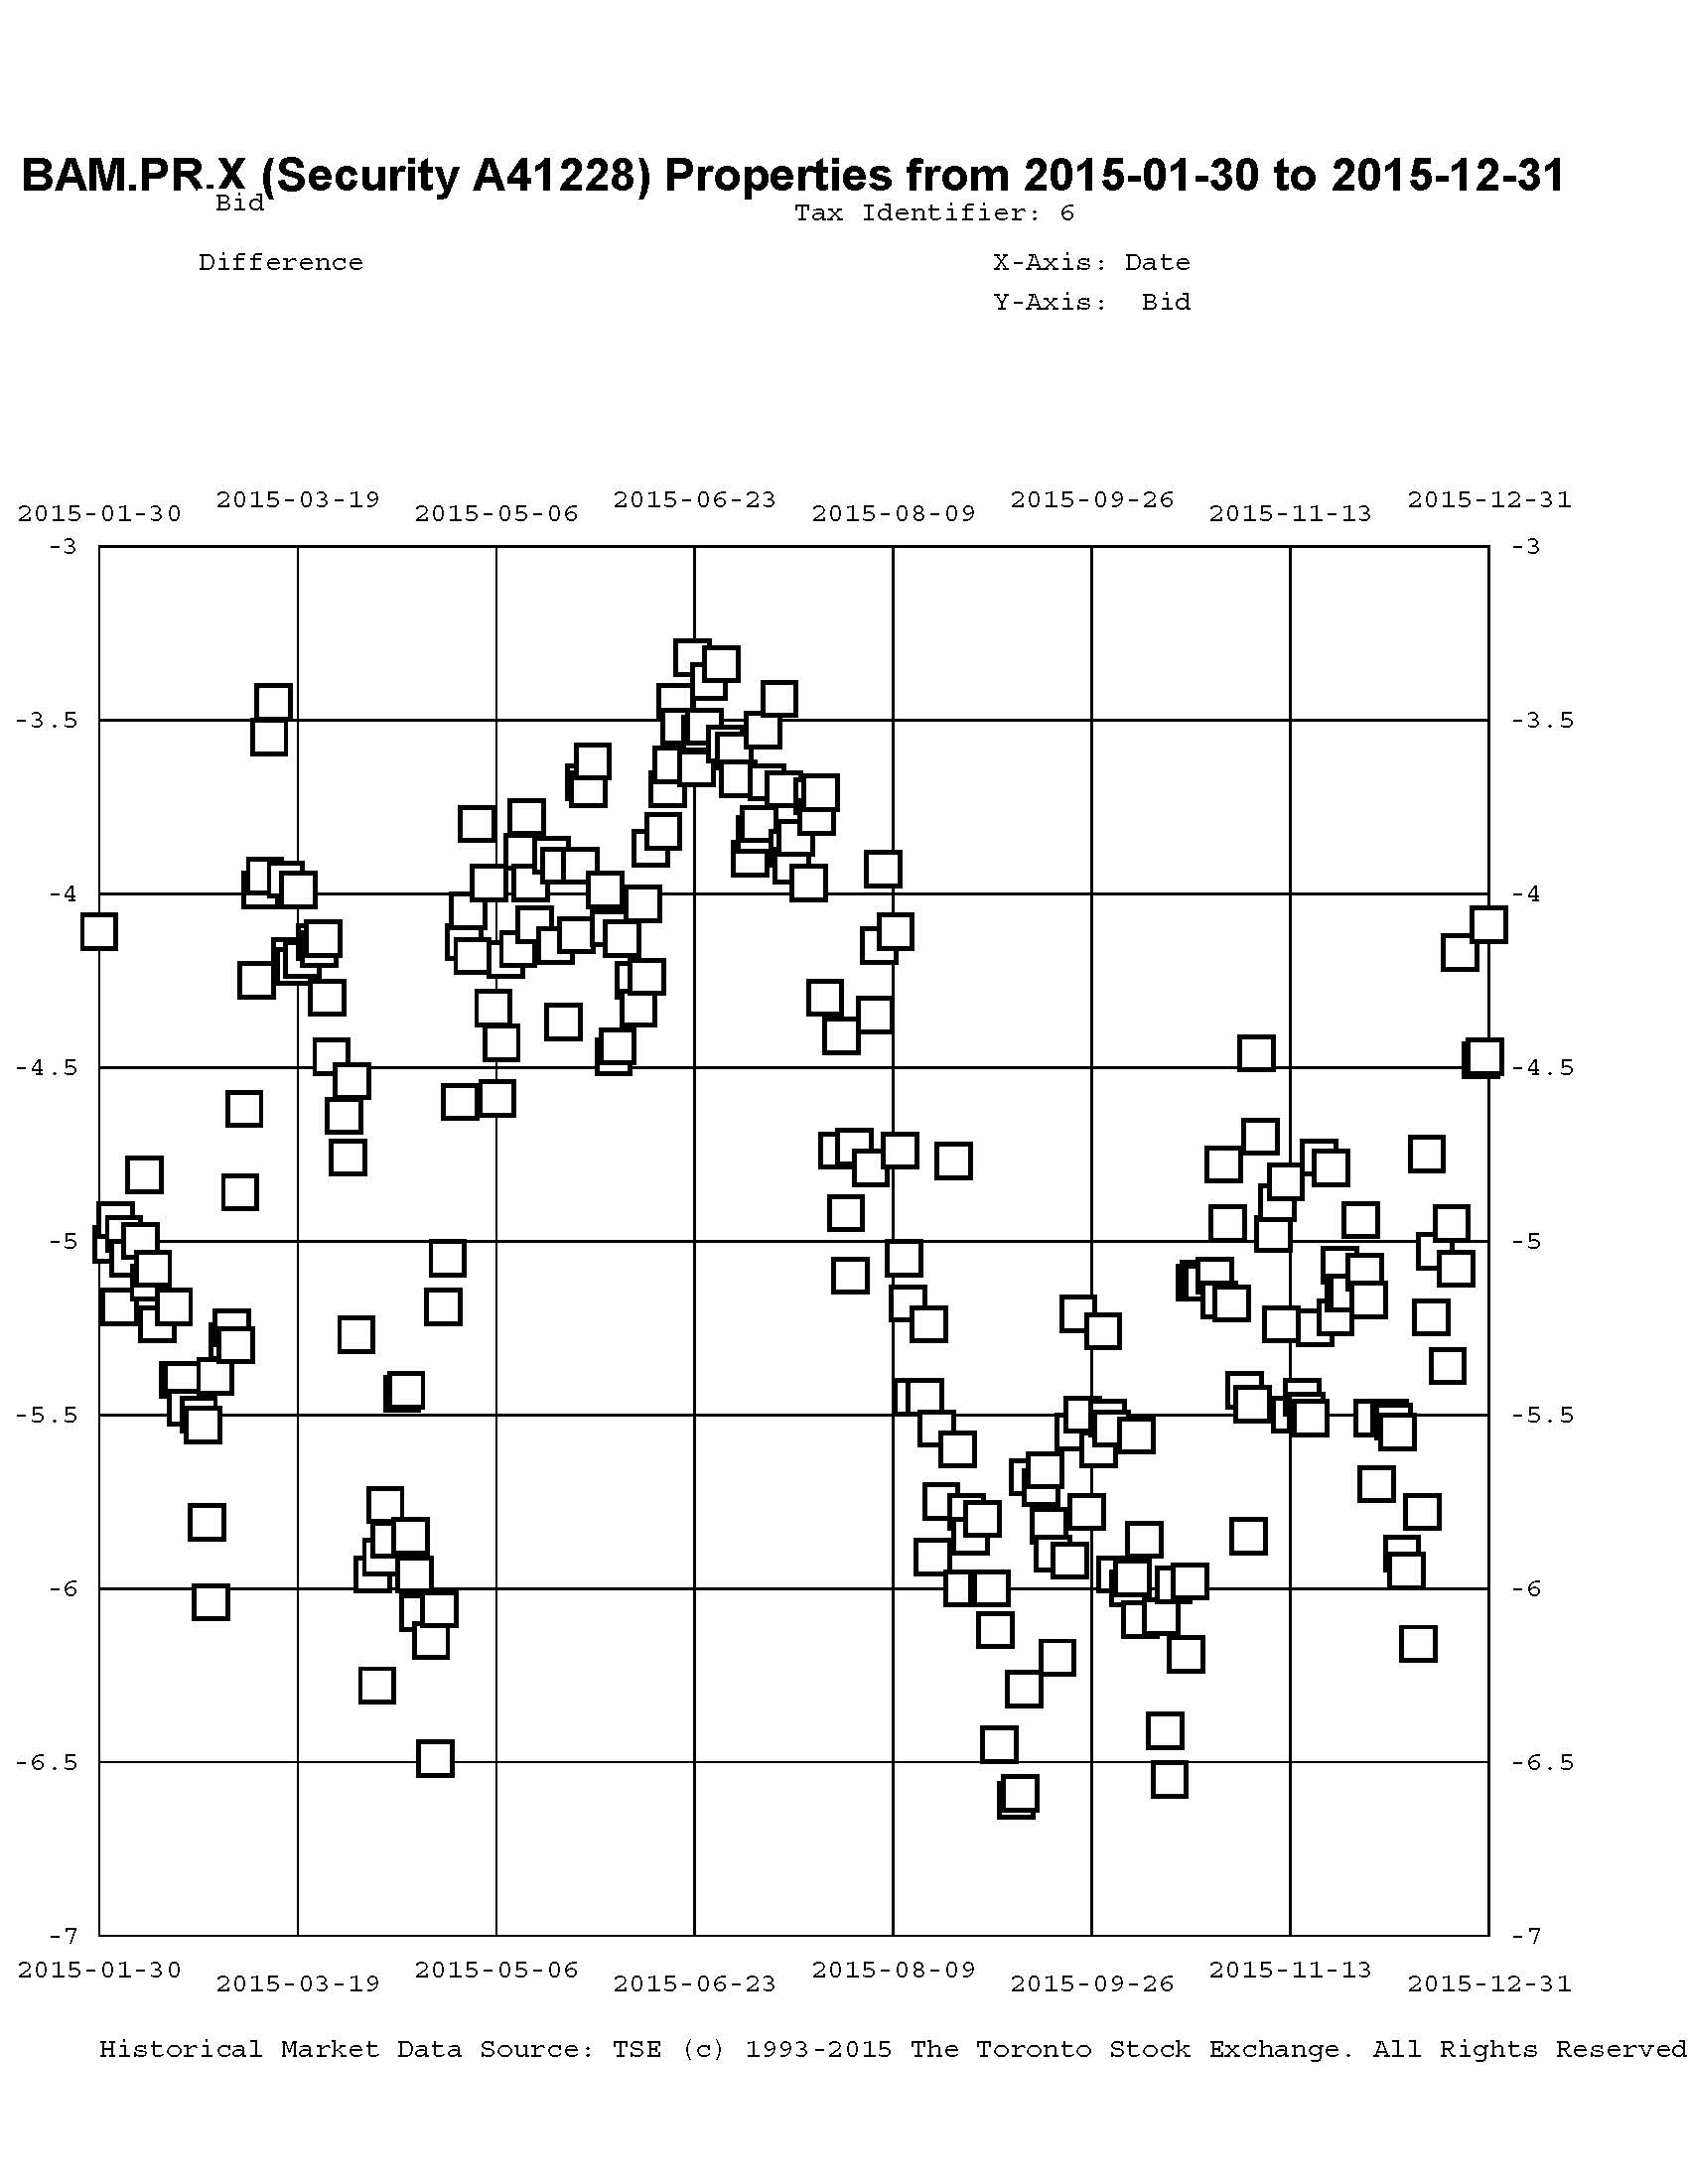
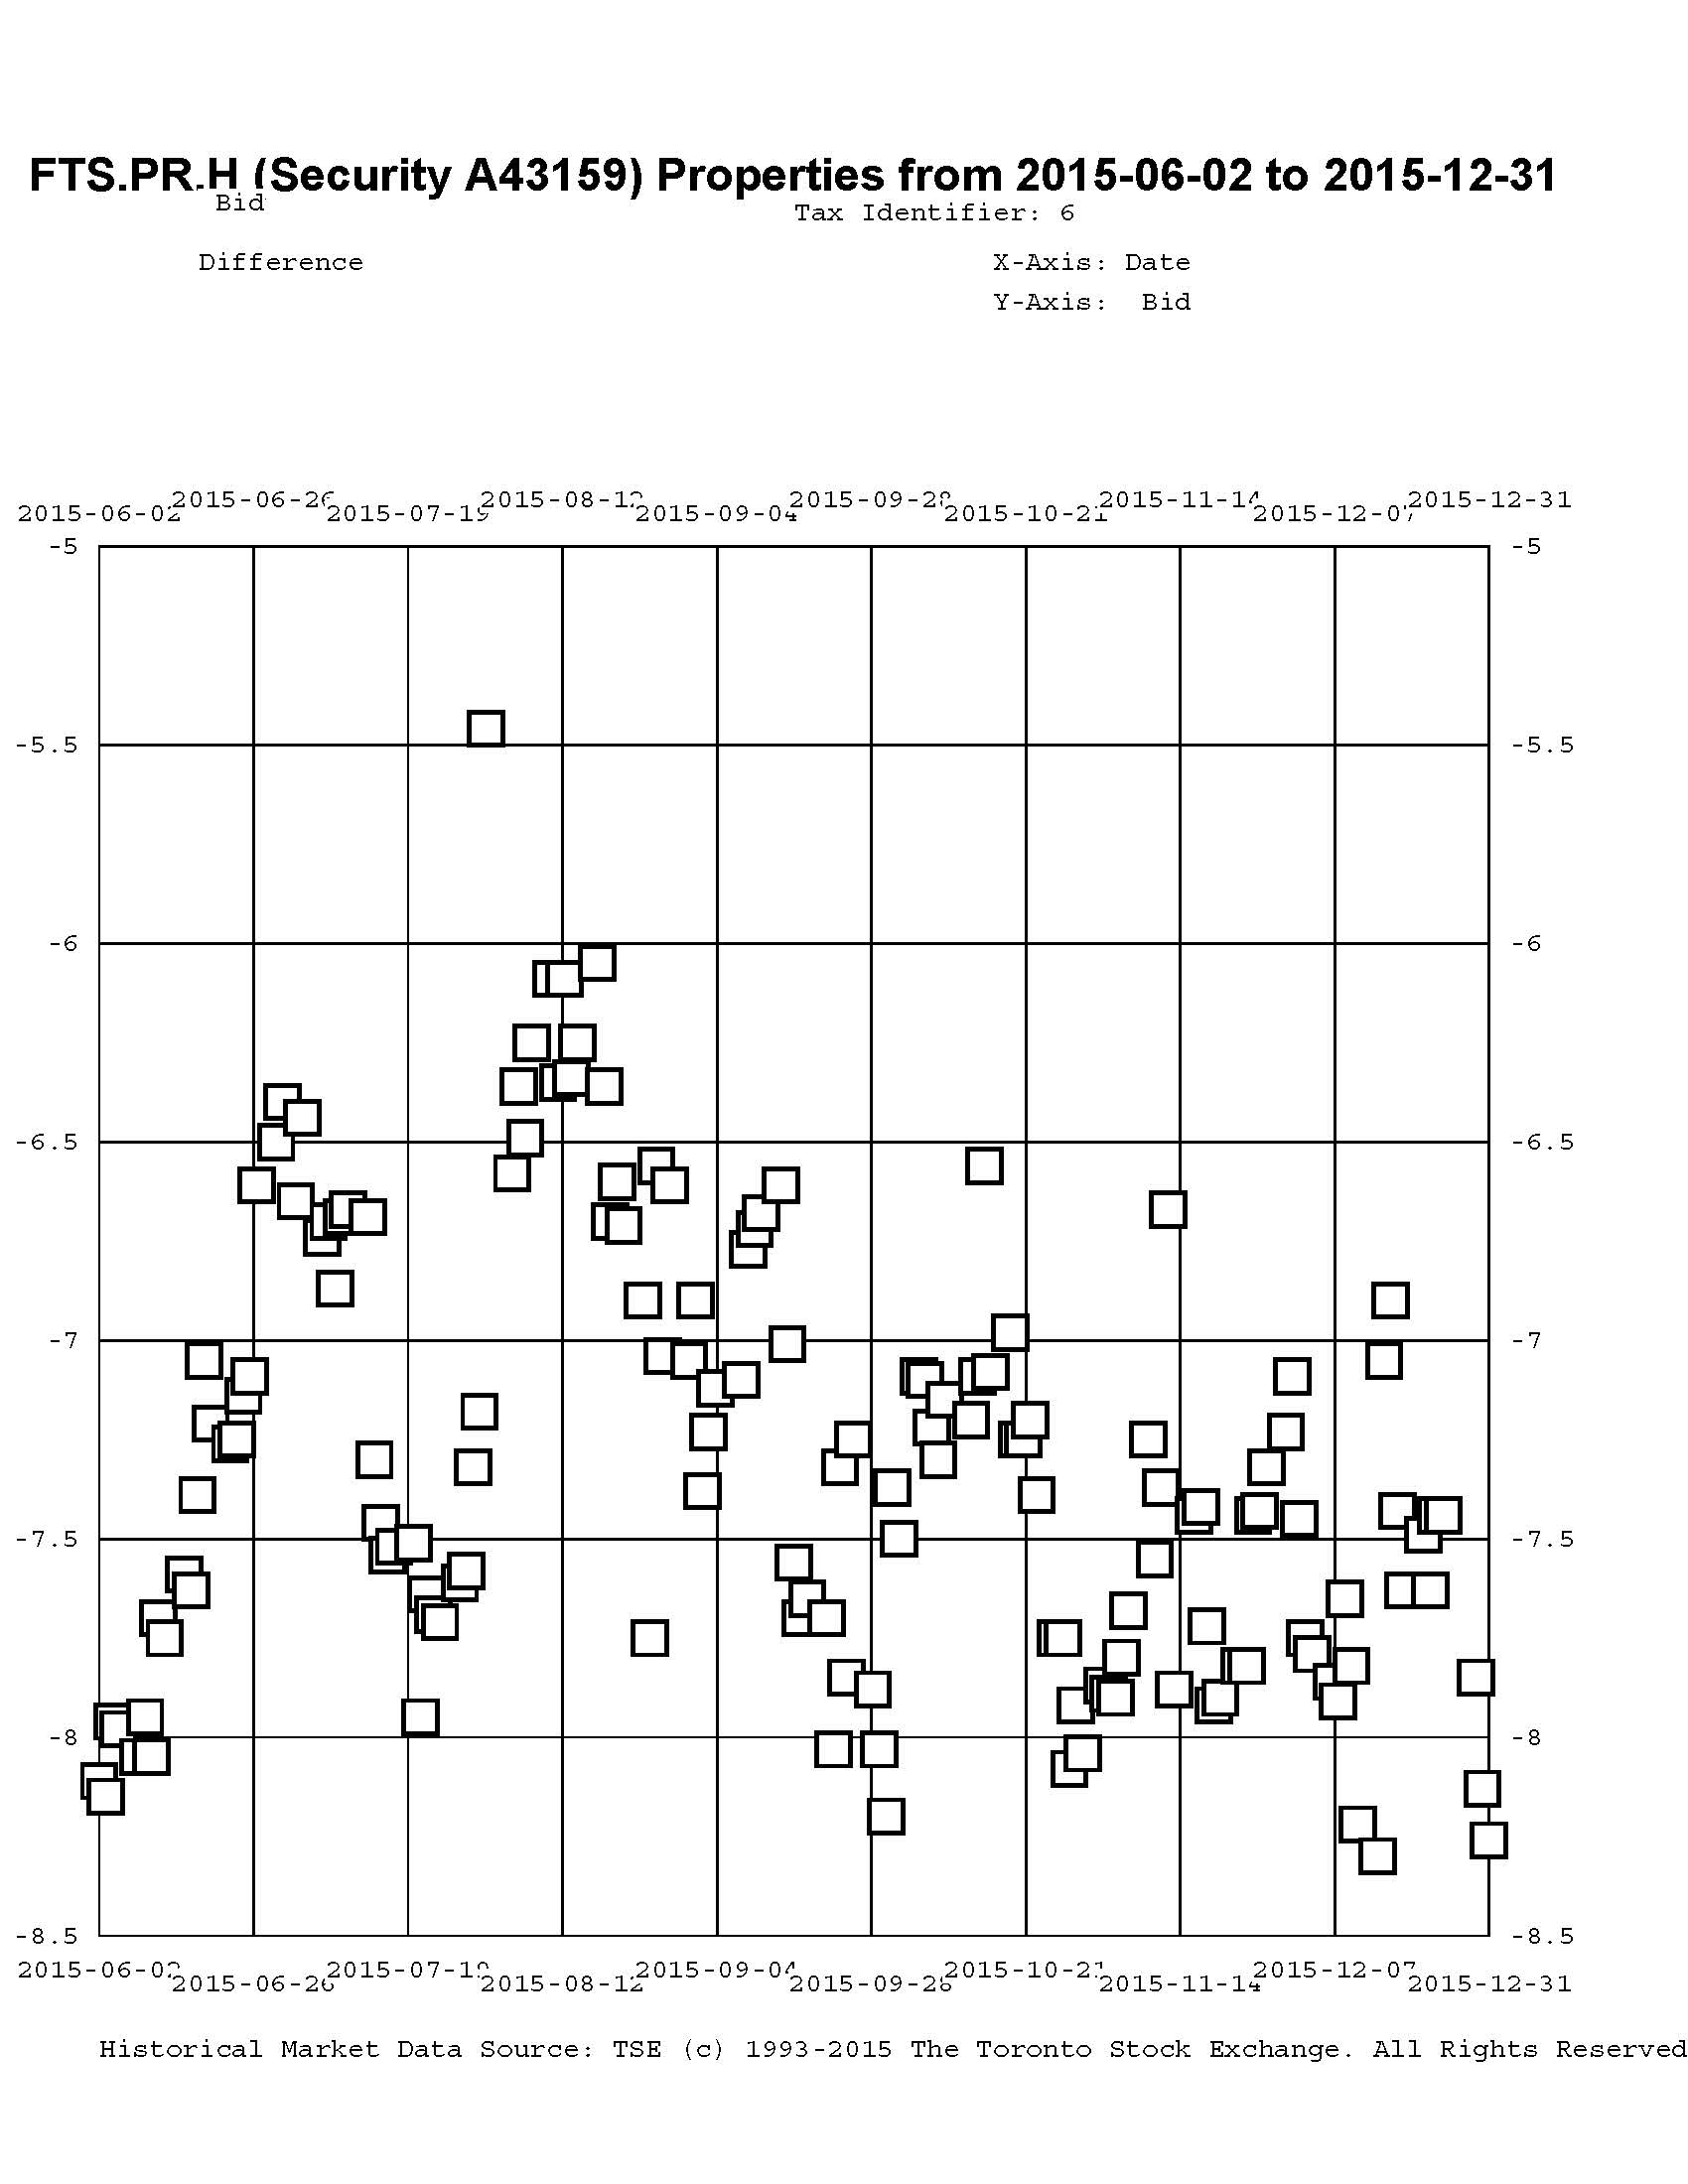
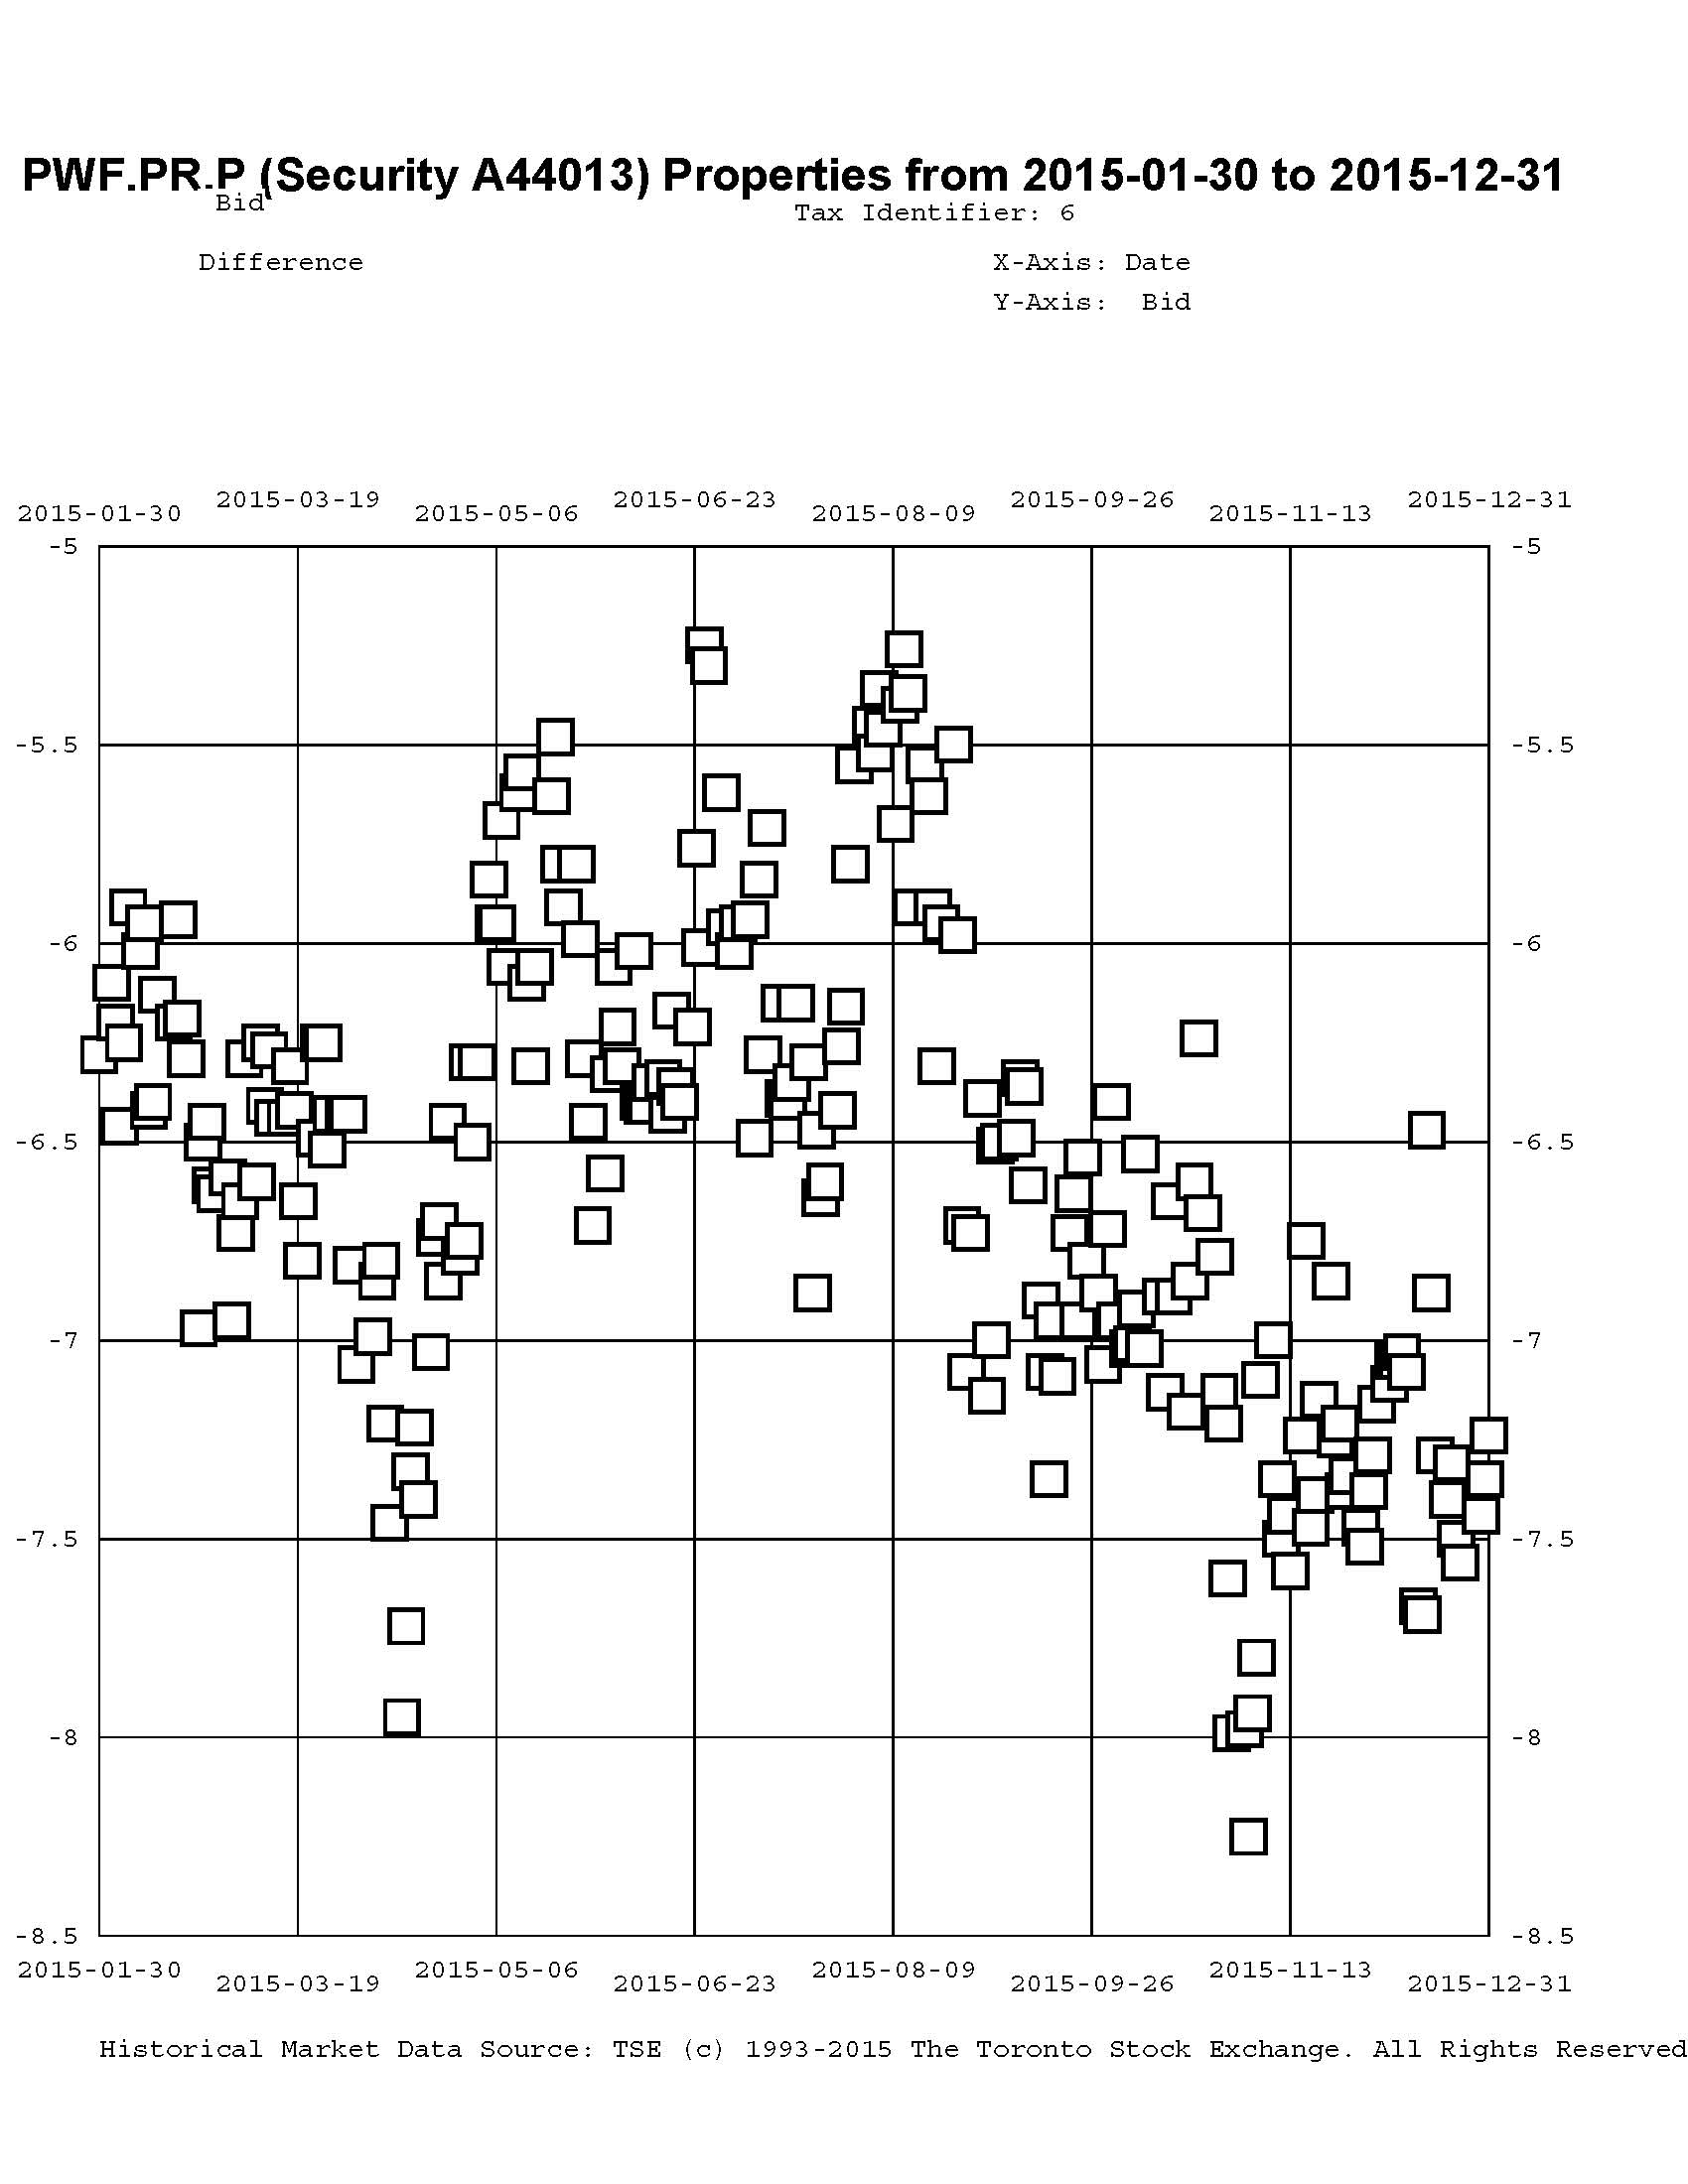
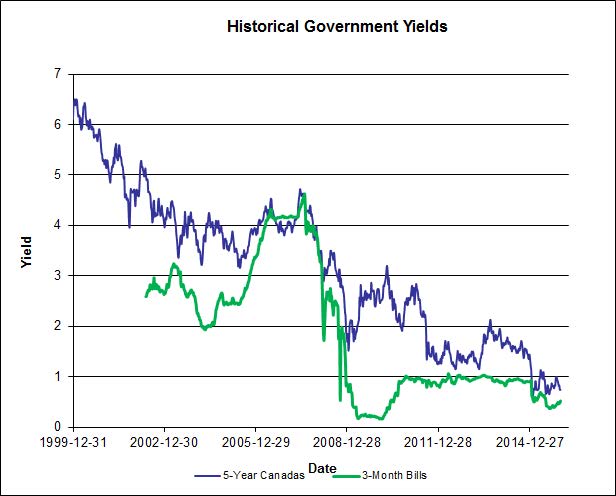
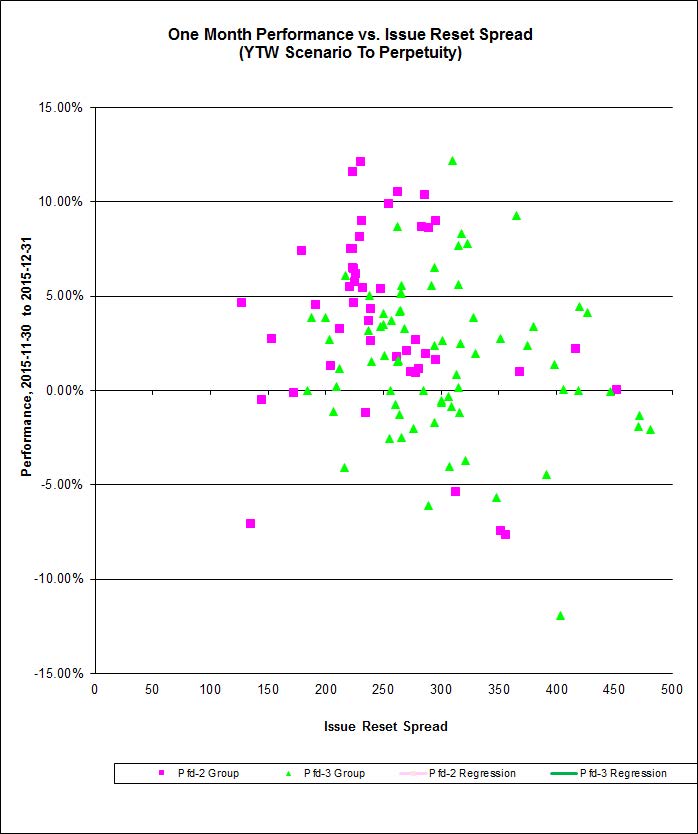
So why is this happening? I believe that a sudden realization that low Canada yields would be reflected in dividends of FixedResets, that started with the reset of TRP.PR.A announced in early December, 2014, turned into unreasonable fear in the spring of 2015 and escalated into blind panic. The yield of FixedResets has decoupled from the five-year Canada rate:
 Click for Big
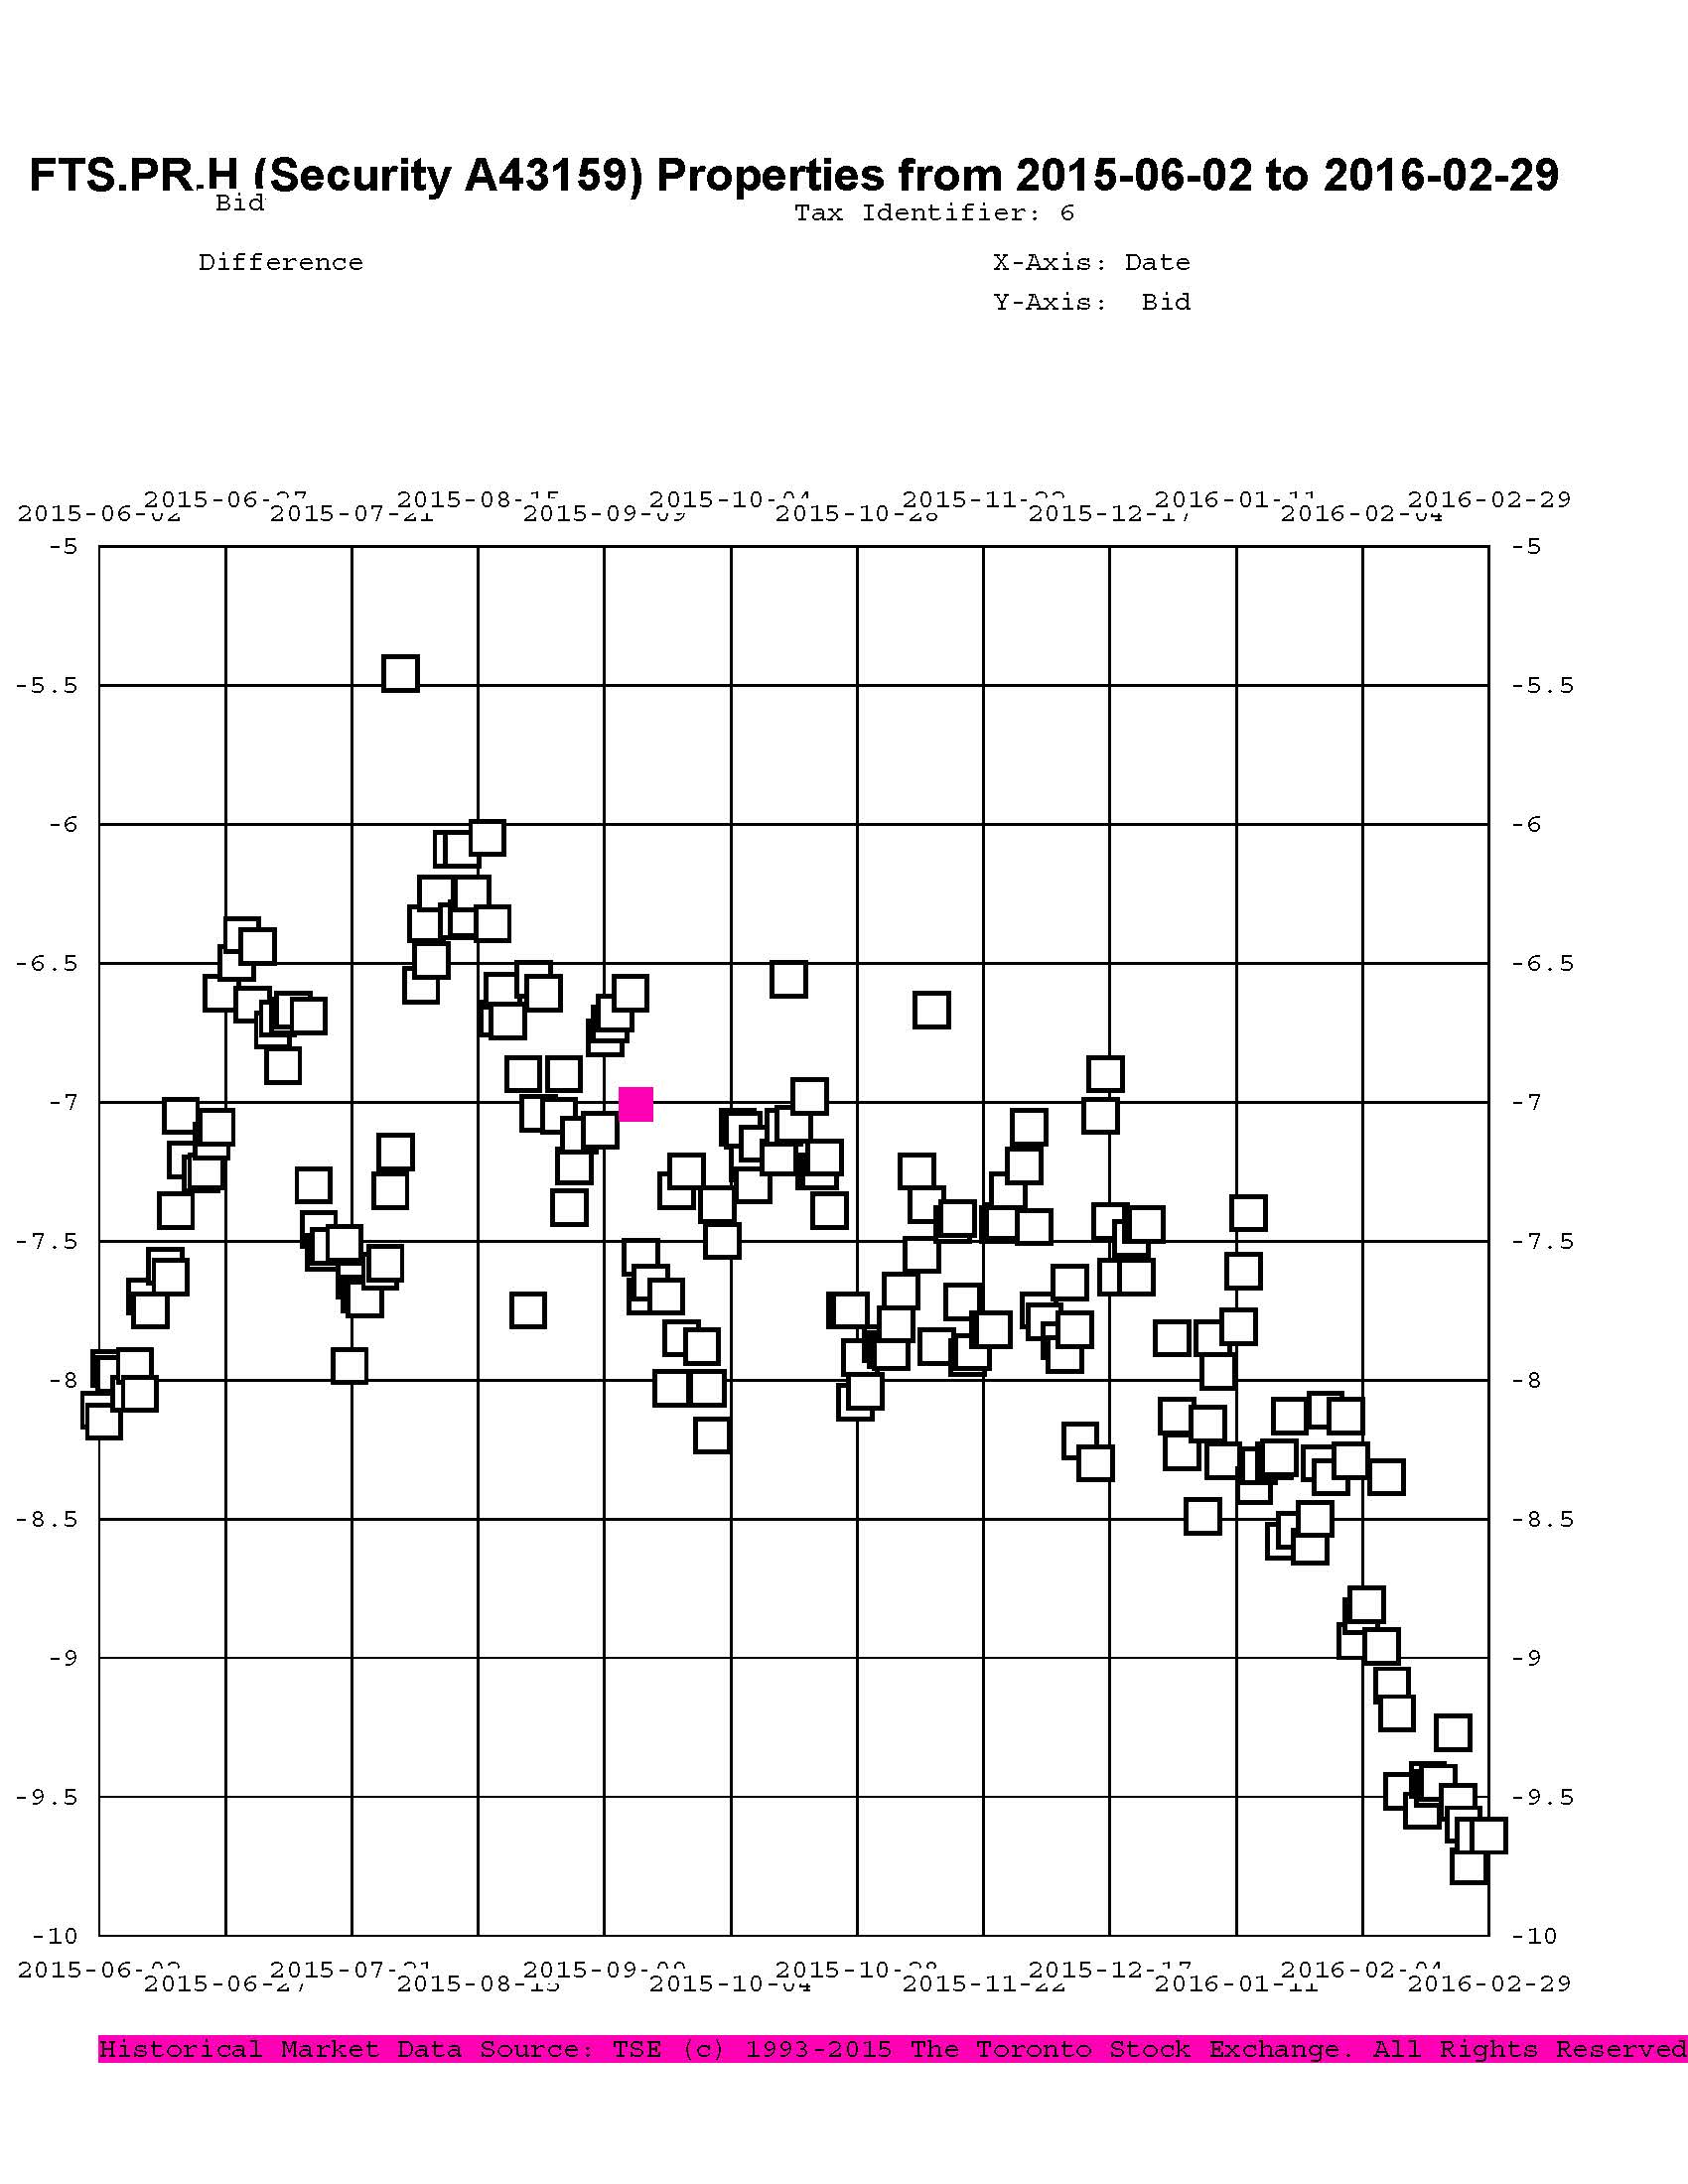
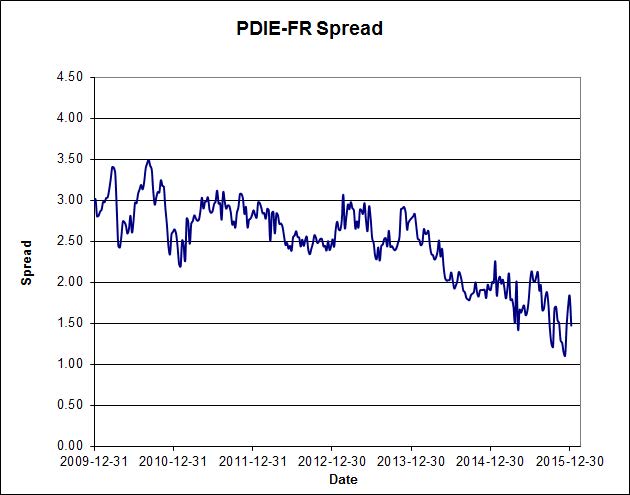
This has led to a narrowing spread between PerpetualDiscounts and FixedResets:
 Click for Big
n.b.: the spread here is “interest-equivalent”
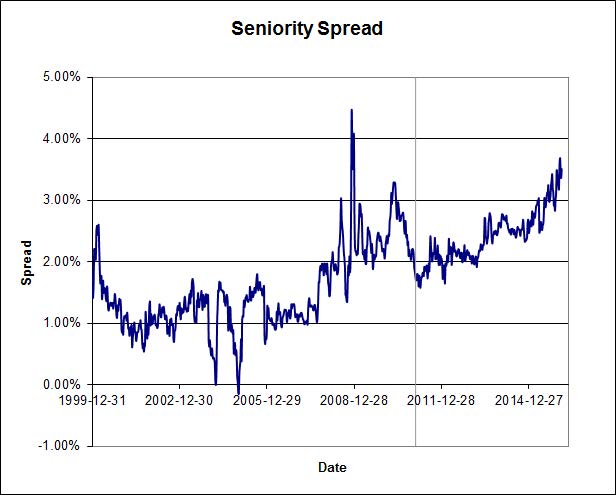
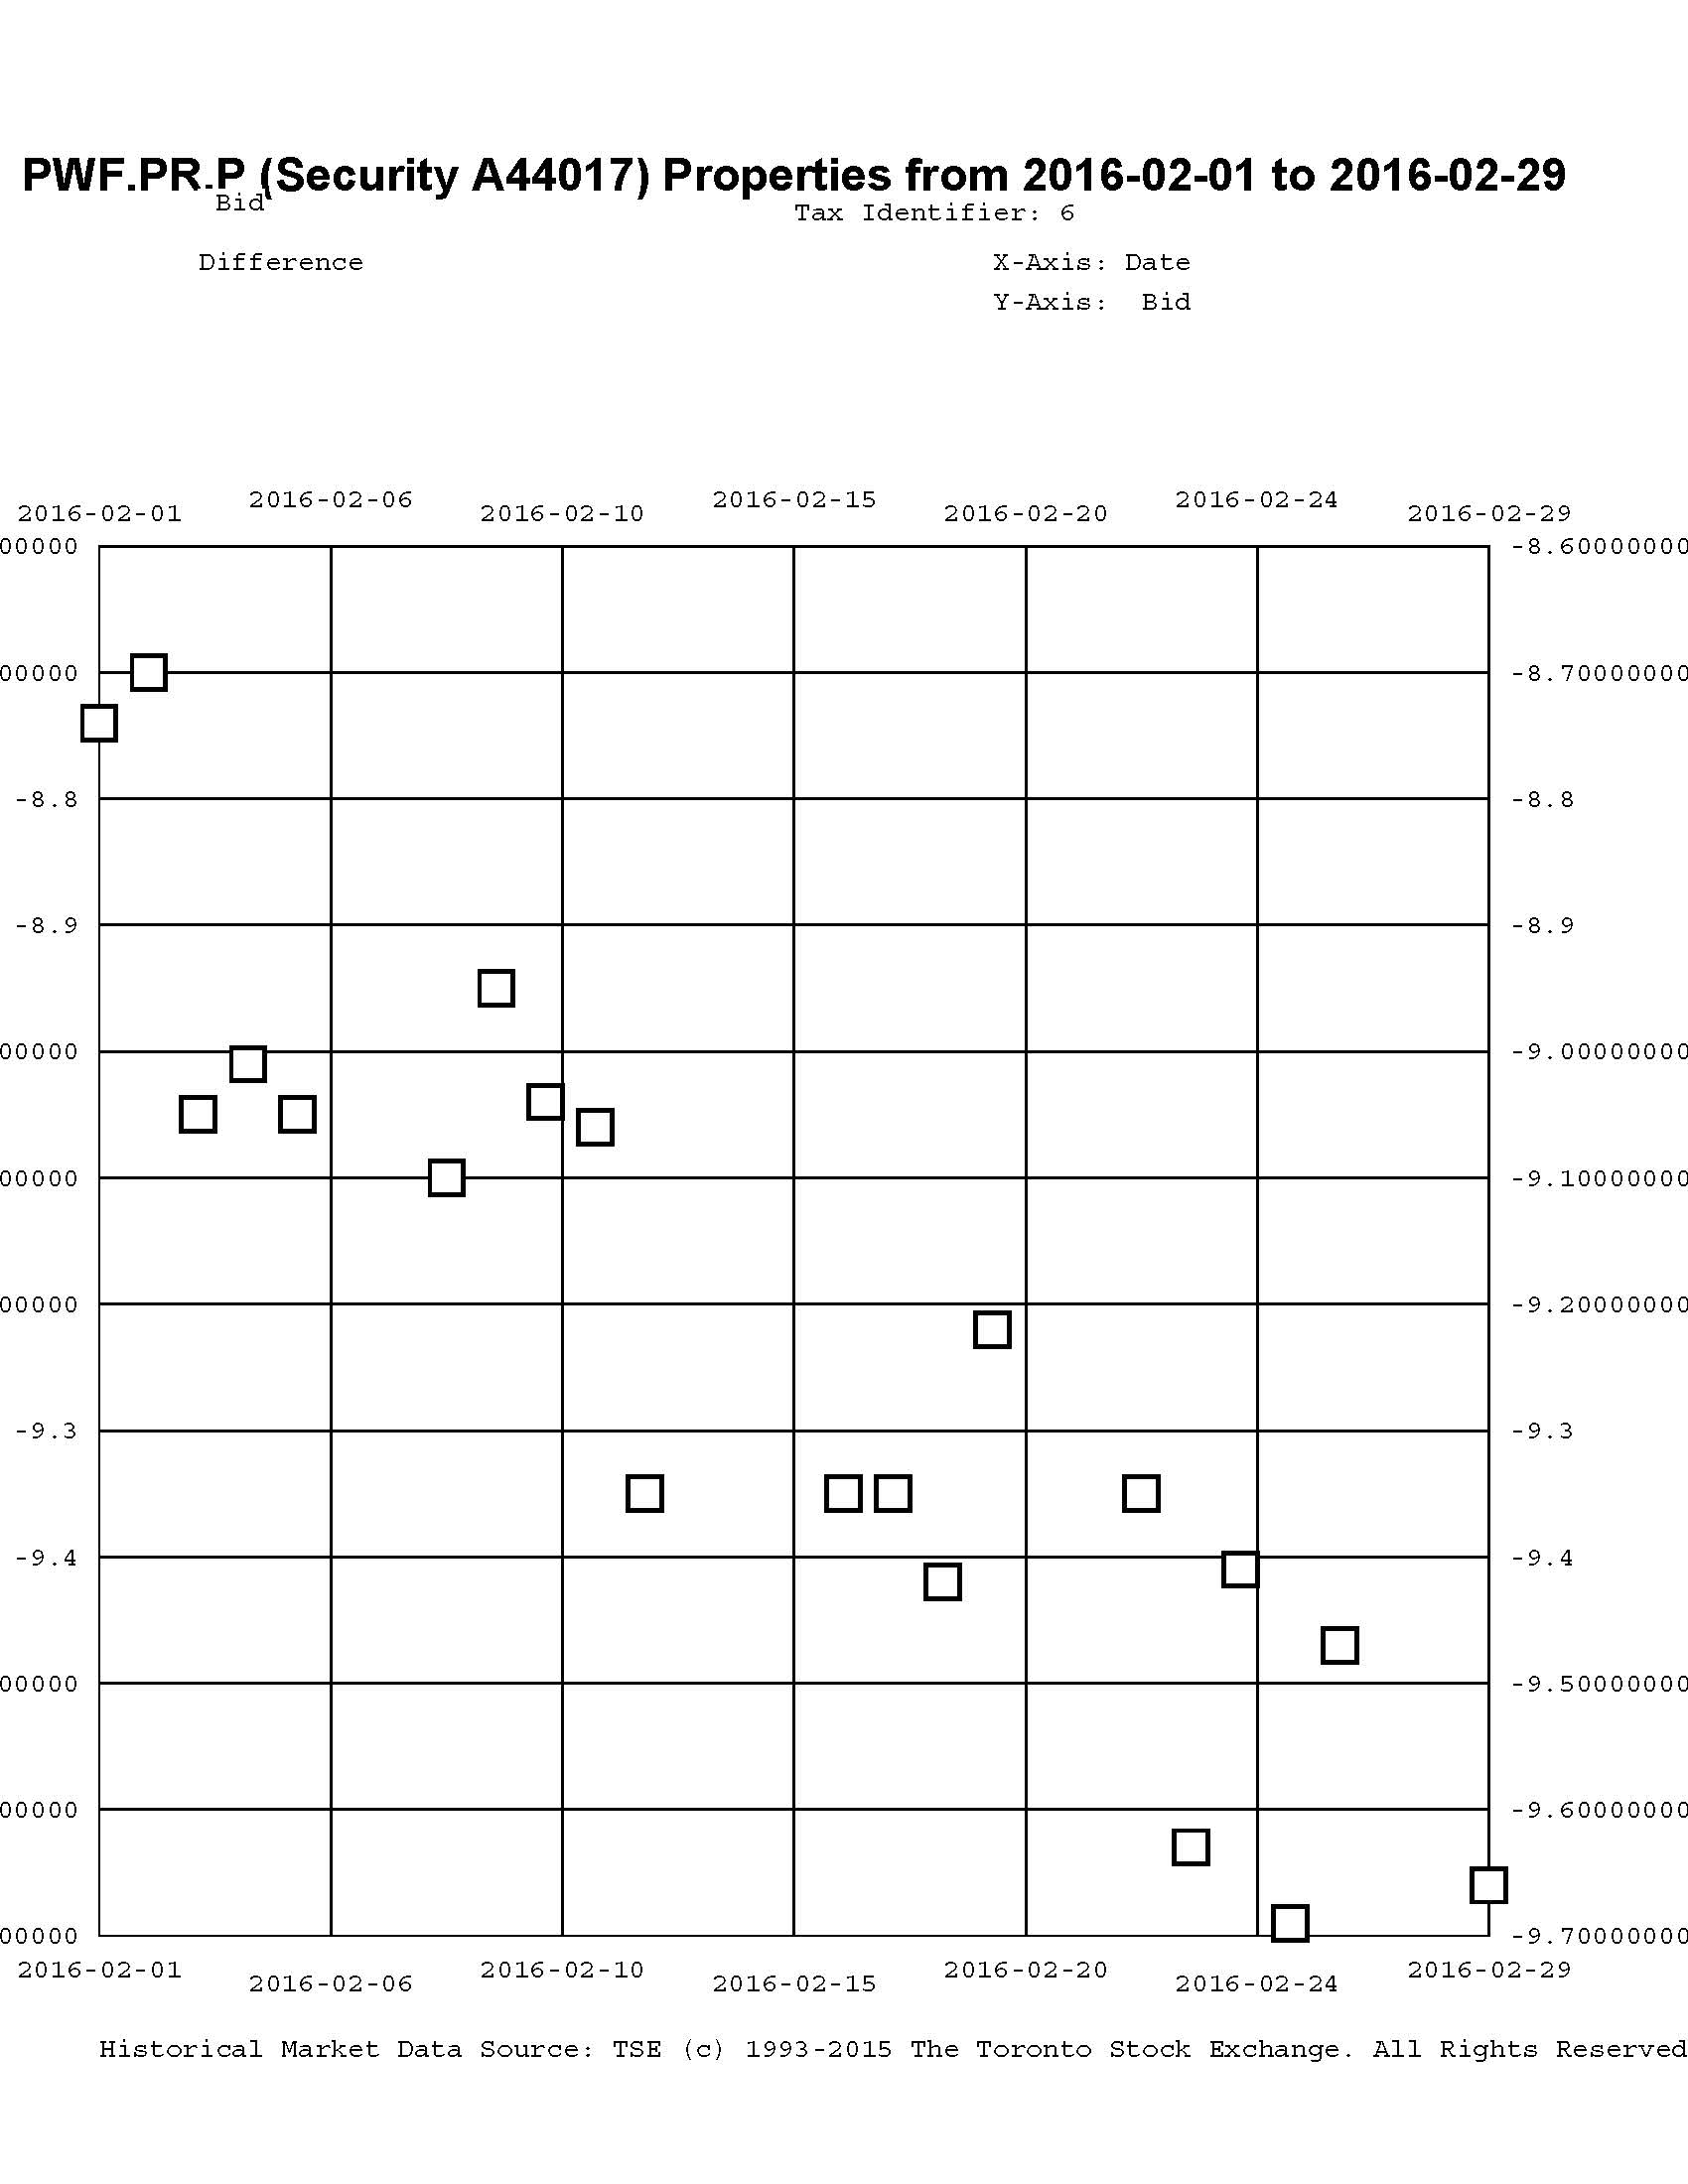
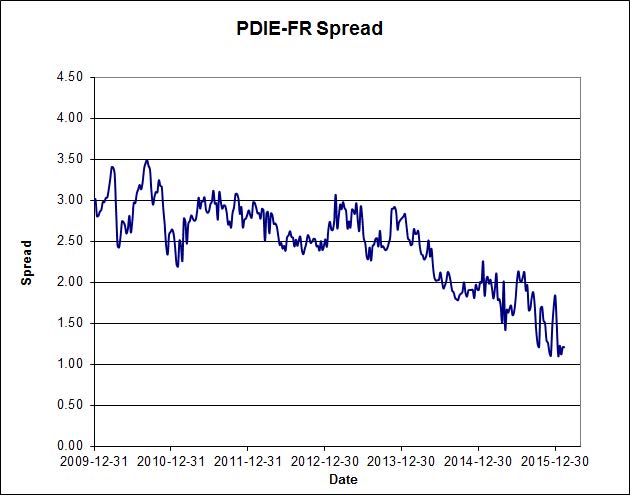
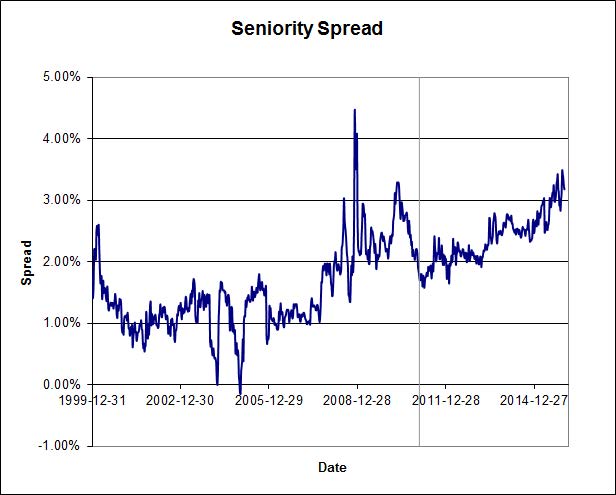
… which has put pressure on the price of PerpetualDiscounts, raising their spread to long corporate bonds to Credit Crunch proportions:
 Click for Big
n.b.: the spread here is “interest equivalent”
So there you have it in a nutshell! Regrettably, I am unable to predict either the timing or the degree of the correction that must happen at some point.
ZPR, is an ETF comprised of FixedResets and Floating Rate issues and a very high proportion of junk issues, returned +2.80%, +8.27% and -20.22% over the past one-, three- and twelve-month periods, respectively (according to the fund’s data), versus returns for the TXPL index of +3.22%, +9.09% and -19.63% respectively. The fund has been able to attract assets of about $1,272-million since inception in December 2012; AUM increased by $178-million in November; given an index return of +3.22% an increase of about $35-million was expected, so there was a very significant cash inflow over the month. I feel that the flows into and out of this fund are very important in determining the performance of its constituents.
TXPR had returns over one-, three- and twelve-months of +2.30%, +6.83% and -14.95% respectively with CPD performance within expectations.
Returns for the HIMIPref™ investment grade sub-indices for the month were as follows:
HIMIPref™ Indices
Performance to December, 2015 |
| Sub-Index |
1-Month |
3-month |
| Ratchet |
N/A |
N/A |
| FixFloat |
N/A |
N/A |
| Floater |
-1.53% |
+4.76% |
| OpRet |
N/A |
N/A |
| SplitShare |
+0.11% |
-0.63% |
| Interest |
N/A |
N/A |
| PerpetualPremium |
+0.13% |
+2.92% |
| PerpetualDiscount |
-0.43% |
+2.63% |
| FixedReset |
+2.48% |
+6.15% |
| DeemedRetractible |
+0.07% |
+2.29% |
| FloatingReset |
-1.69% |
+4.47% |
Malachite Aggressive Preferred Fund’s Net Asset Value per Unit as of the close December 31, 2015, was $8.1379 after a distribution of 0.11042.
| Returns to December 31, 2015 |
| Period |
MAPF |
BMO-CM “50” Index |
TXPR
Total Return |
CPD – according to Blackrock |
| One Month |
+1.99% |
+2.23% |
+2.30% |
N/A |
| Three Months |
+5.56% |
+5.84% |
+6.83% |
N/A |
| One Year |
-18.81% |
-15.10% |
-14.95% |
-15.25% |
| Two Years (annualized) |
-4.39% |
-5.50% |
-4.68% |
N/A |
| Three Years (annualized) |
-4.30% |
-4.10% |
-4.01% |
-4.39% |
| Four Years (annualized) |
-0.29% |
-1.78% |
-1.71% |
N/A |
| Five Years (annualized) |
+0.12% |
+0.06% |
-0.26% |
-0.72% |
| Six Years (annualized) |
+2.65% |
+1.67% |
+1.03% |
|
| Seven Years (annualized) |
+9.97% |
+5.24% |
+4.38% |
|
| Eight Years (annualized) |
+8.14% |
+2.25% |
+1.46% |
|
| Nine Years (annualized) |
+7.01% |
+1.28% |
|
|
| Ten Years (annualized) |
+7.00% |
+1.57% |
|
|
| Eleven Years (annualized) |
+6.90% |
1.78% |
|
|
| Twelve Years (annualized) |
+7.43% |
+2.12% |
|
|
| Thirteen Years (annualized) |
+9.24% |
+2.51% |
|
|
| Fourteen Years (annualized) |
8.64% |
+2.65% |
|
|
| MAPF returns assume reinvestment of distributions, and are shown after expenses but before fees. |
| CPD Returns are for the NAV and are after all fees and expenses. |
| Figures for National Bank Preferred Equity Income Fund (formerly Omega Preferred Equity) (which are after all fees and expenses) for 1-, 3- and 12-months are +0.66%, +5.16% and -10.84%, respectively, according to Morningstar after all fees & expenses. Three year performance is -1.93%; five year is +0.96% |
| Figures for Manulife Preferred Income Class Adv [into which was merged Manulife Preferred Income Fund (formerly AIC Preferred Income Fund)] (which are after all fees and expenses) for 1-, 3- and 12-months are +1.41%, +5.73% & -16.03%, respectively. It will be noted that AIC Preferred Income Fund was in existence prior to August, 2009, but long term performance figures have been suppressed. |
| Figures for Horizons Active Preferred Share ETF (which are after all fees and expenses) for 1-, 3- and 12-months are +1.29%, +6.00% & -12.67%, respectively. Three year performance is -2.65%, five-year is +0.86% |
| Figures for National Bank Preferred Equity Fund (formerly Altamira Preferred Equity Fund) are +1.15%, +5.61% and -14.01% for one-, three- and twelve months, respectively. Three year performance is -4.32% |
| The figure for BMO S&P/TSX Laddered Preferred Share Index ETF is +2.80%, +8.27% and -20.22% for one-, three- and twelve-months, respectively. Two year performance is -8.60%, three year is -6.92%. |
| Figures for NexGen Canadian Preferred Share Tax Managed Fund (Dividend Tax Credit Class, the best performing) are -%, +% and -% for one-, three- and twelve-months, respectively. |
| Figures for BMO Preferred Share Fund are +5.20% and -14.23% for the past three- and twelve-months, respectively. |
| Figures for PowerShares Canadian Preferred Share Index Class, Series F are -15.51% for the past twelve months. The three-year figure is -5.44%. |
| Figures for the First Asset Preferred Share Investment Trust (PSF.UN) are +1.27%, +3.61% and -22.97% for the past one, three and twelve months, respectively. The two-, three-, four- and five-year figures are -10.24%, -7.93%, -5.22% and -4.13%, respectively. |
MAPF returns assume reinvestment of dividends, and are shown after expenses but before fees. Past performance is not a guarantee of future performance. You can lose money investing in Malachite Aggressive Preferred Fund or any other fund. For more information, see the fund’s main page. The fund is available either directly from Hymas Investment Management or through a brokerage account at Odlum Brown Limited.
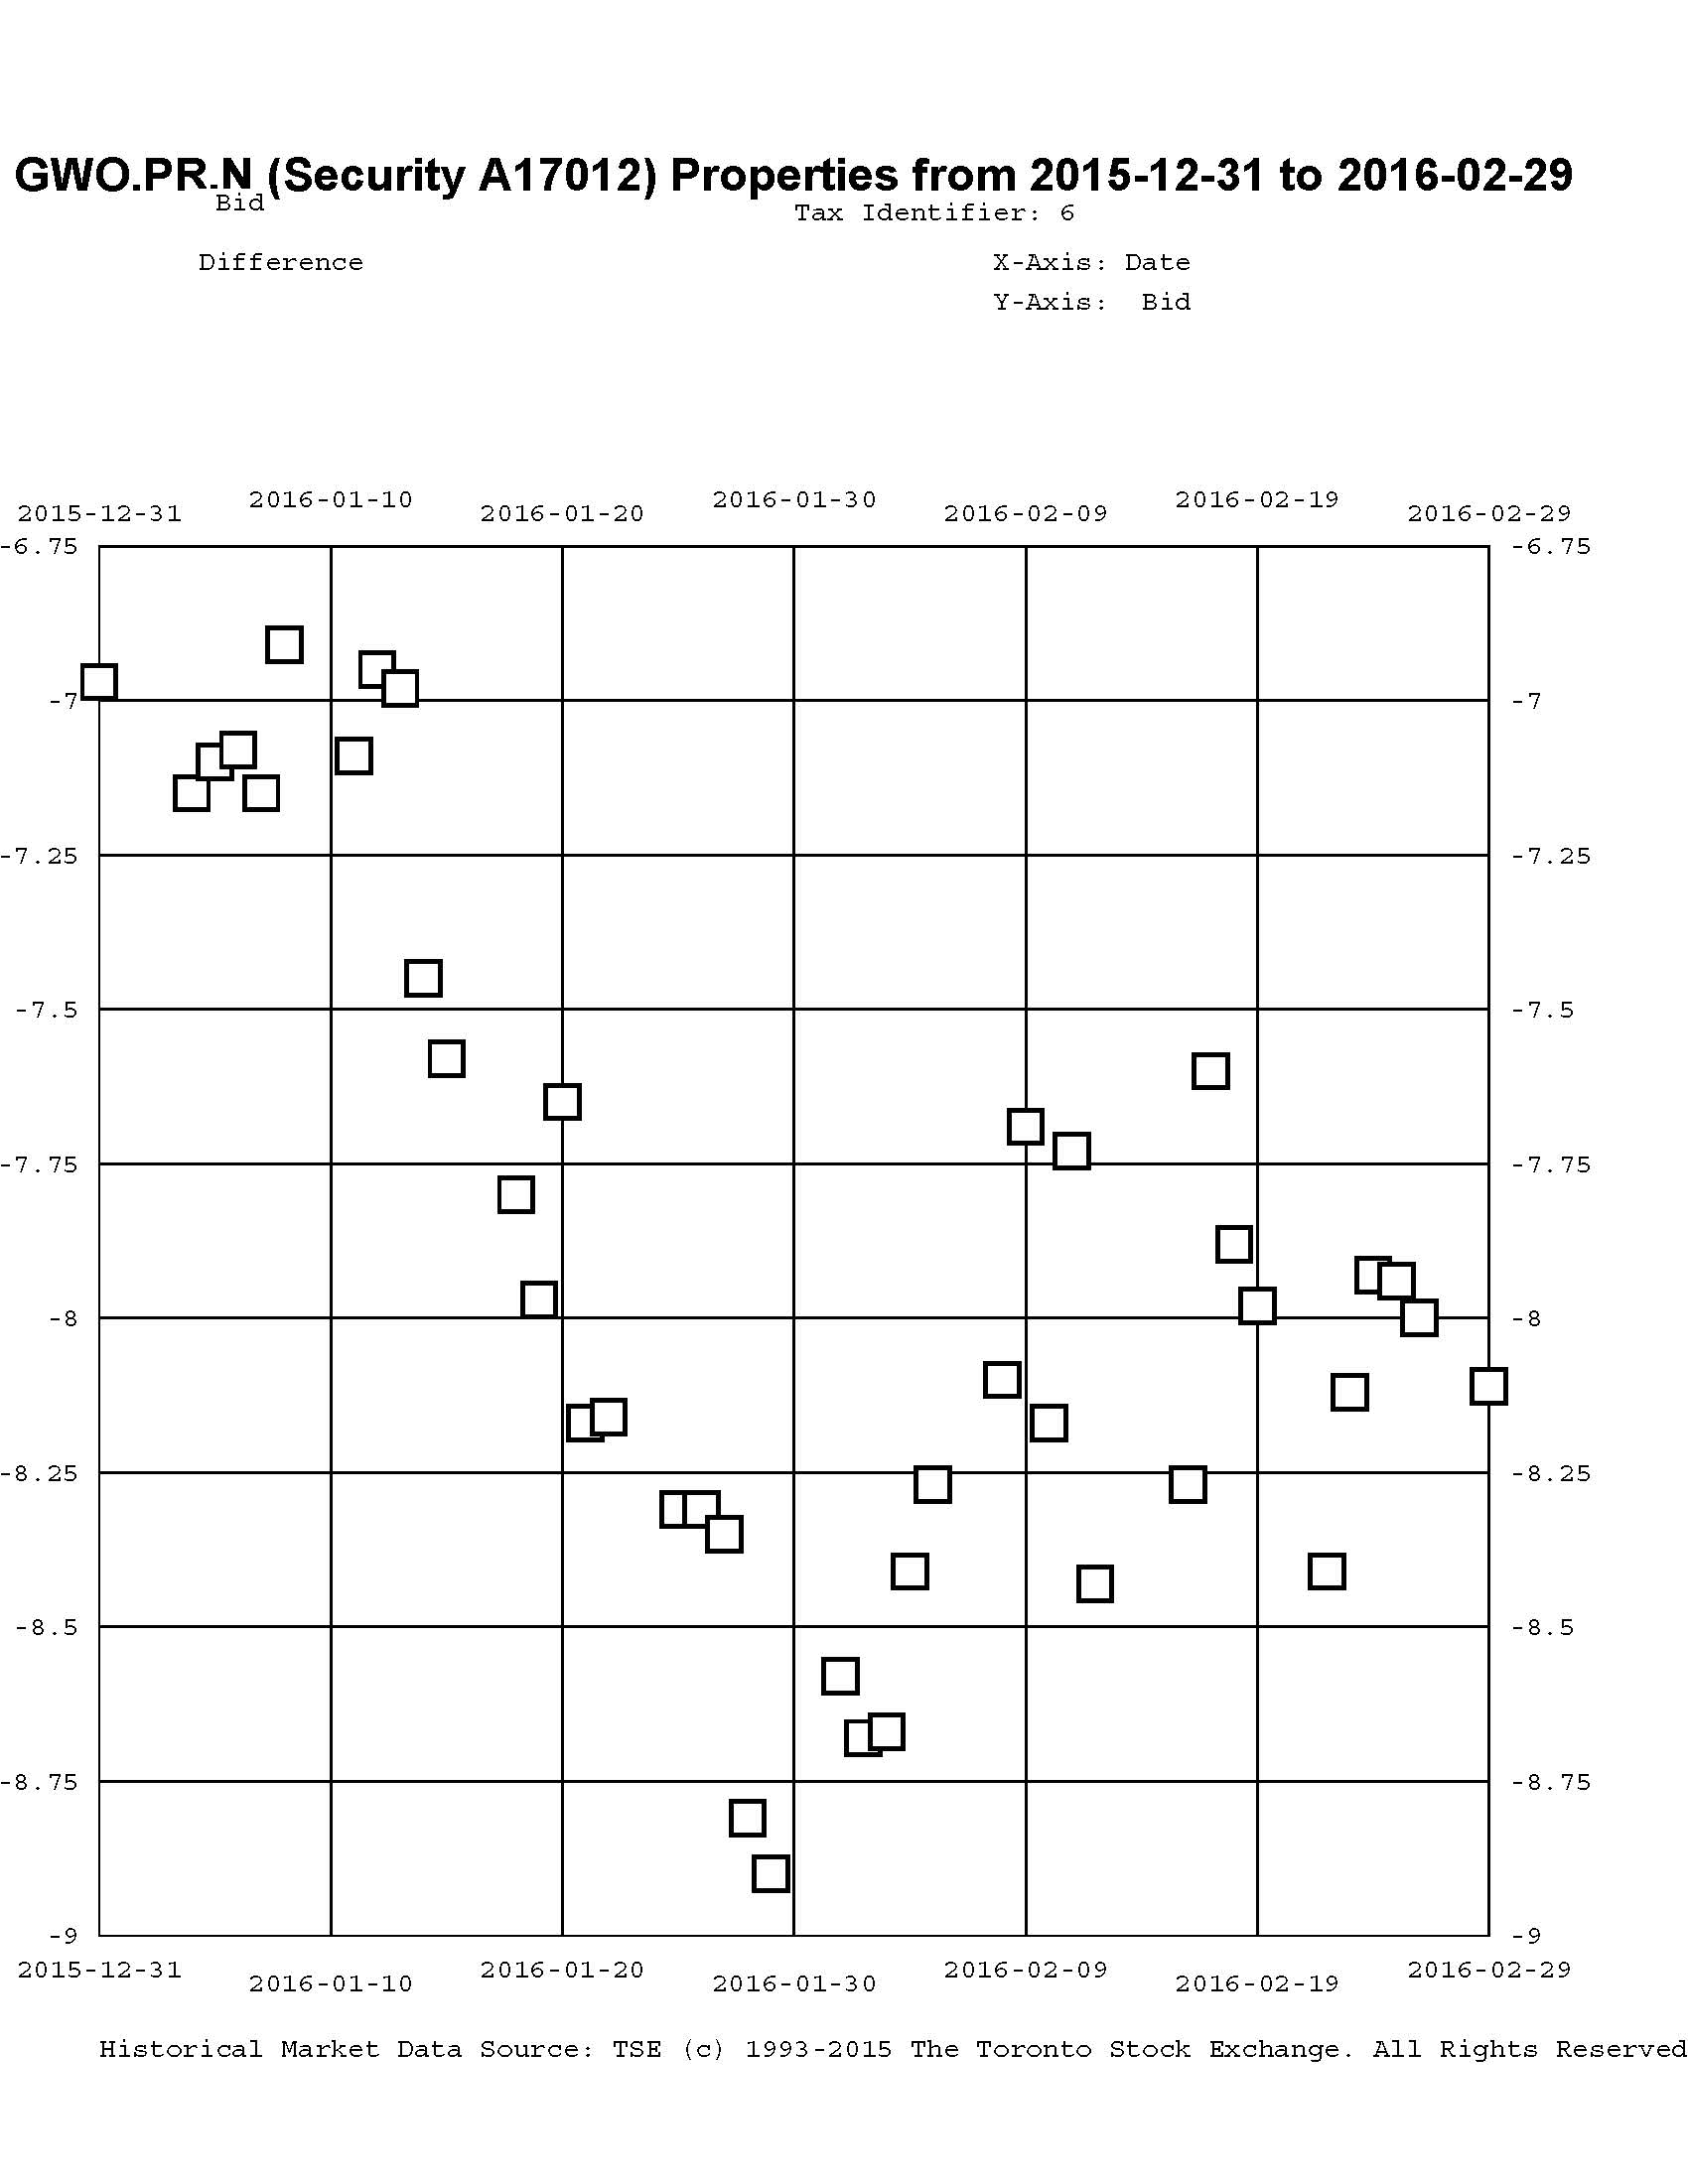
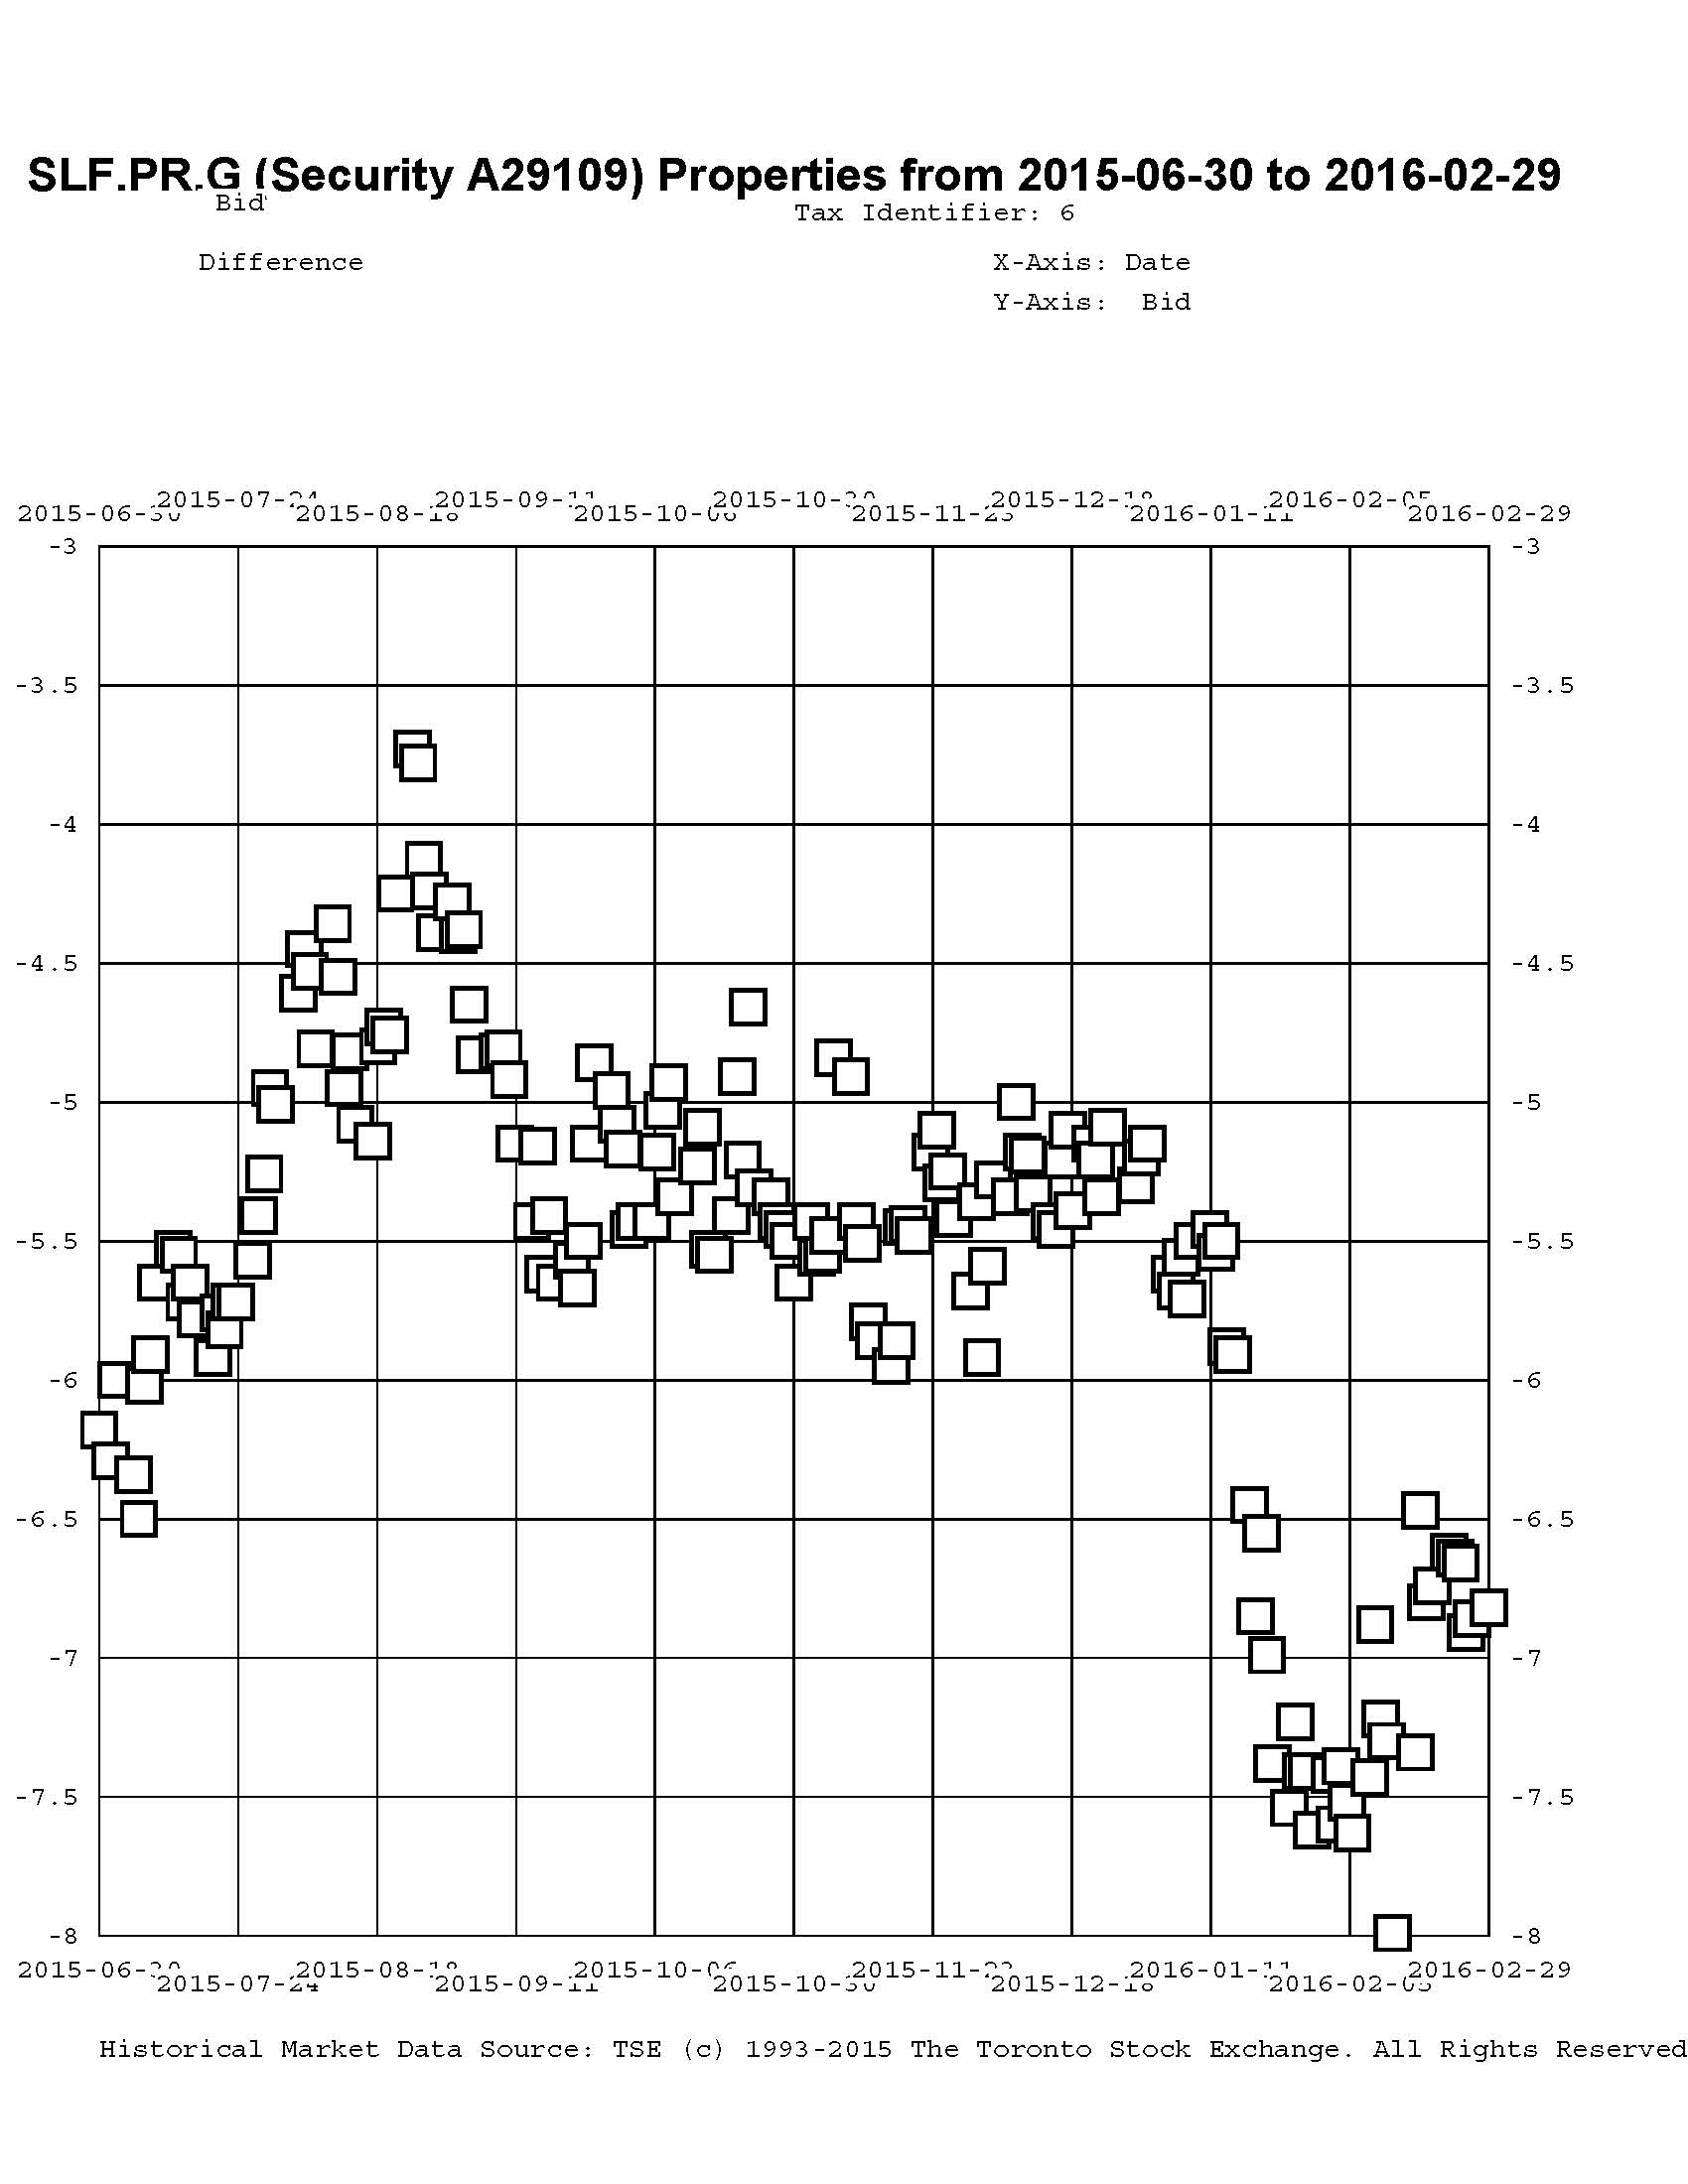
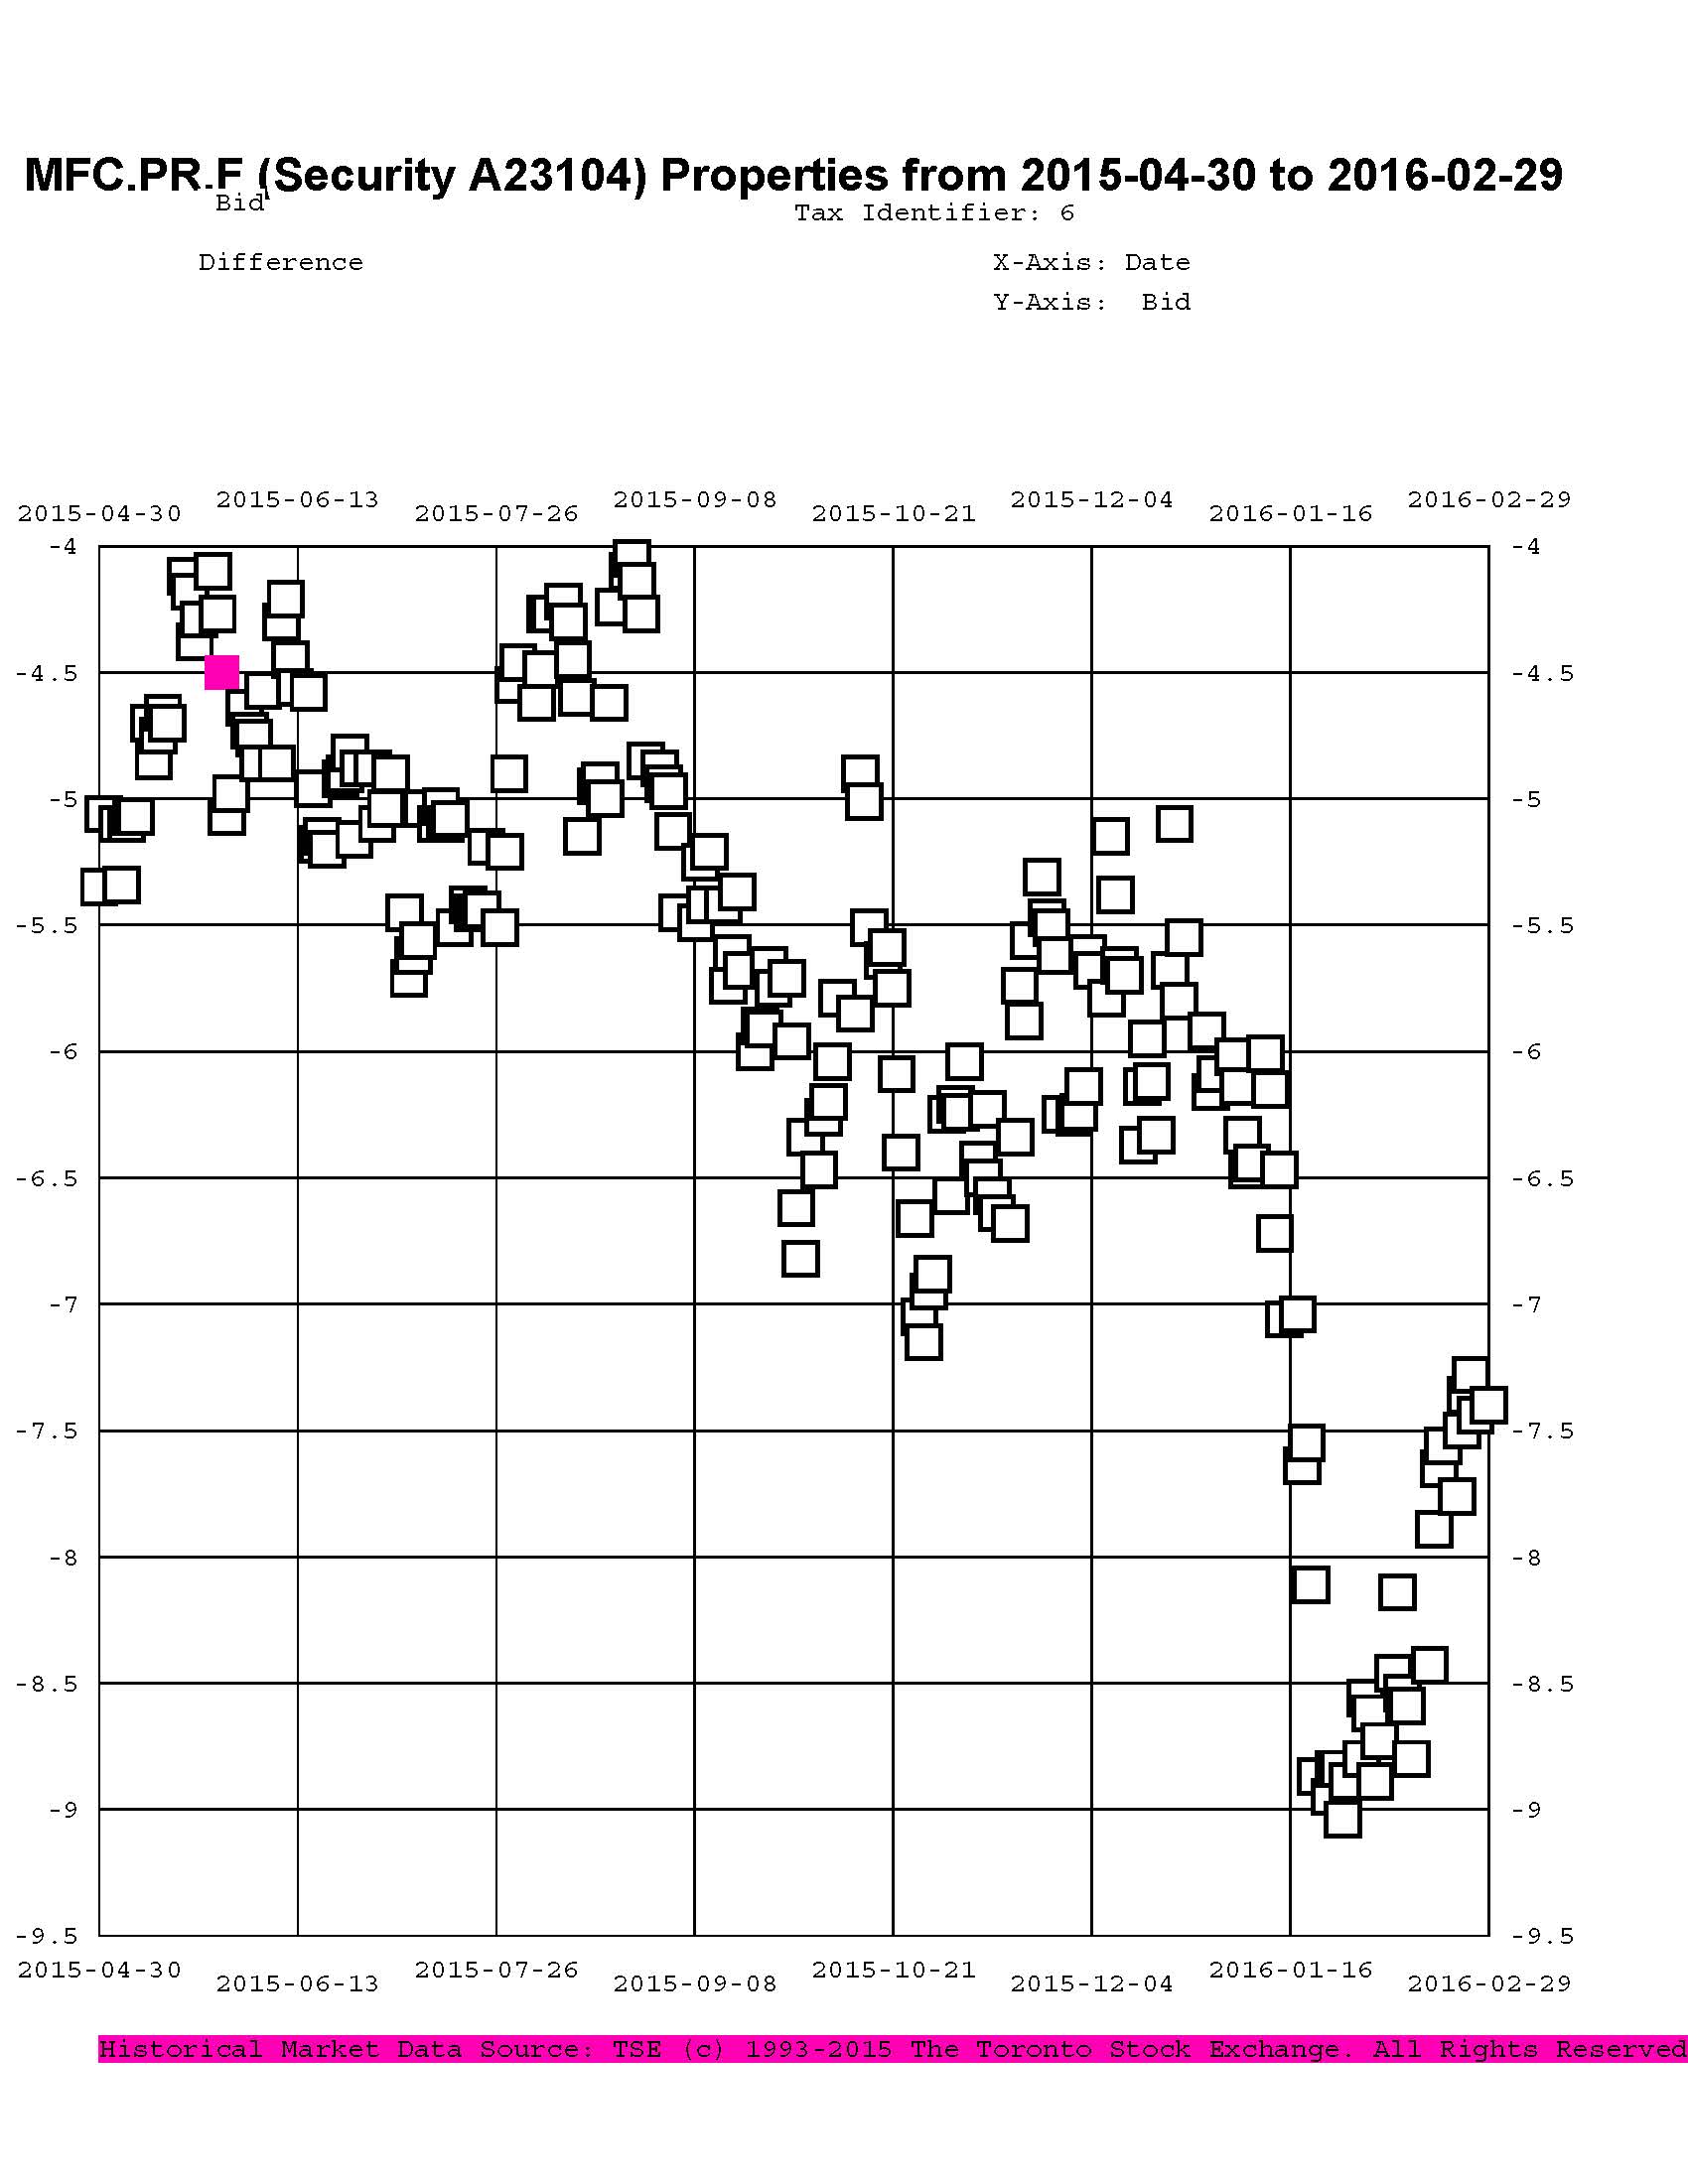
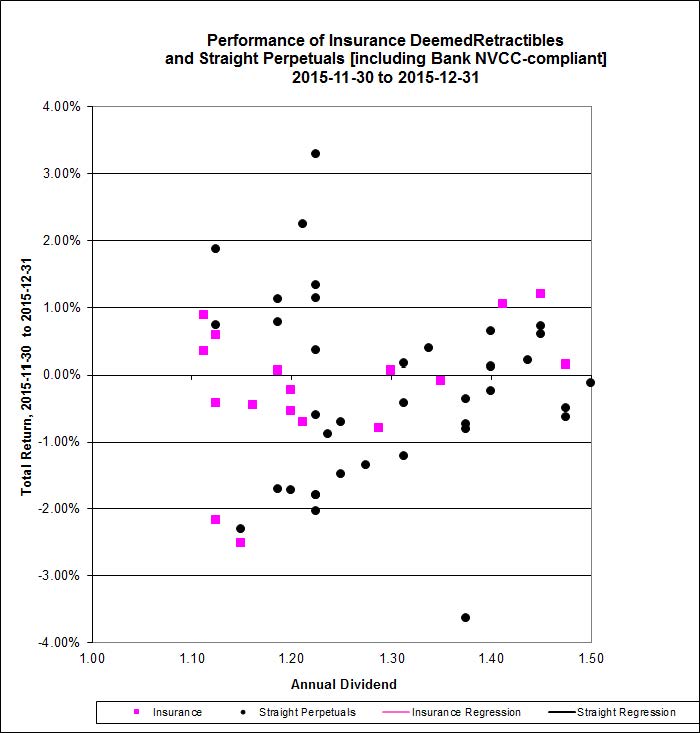
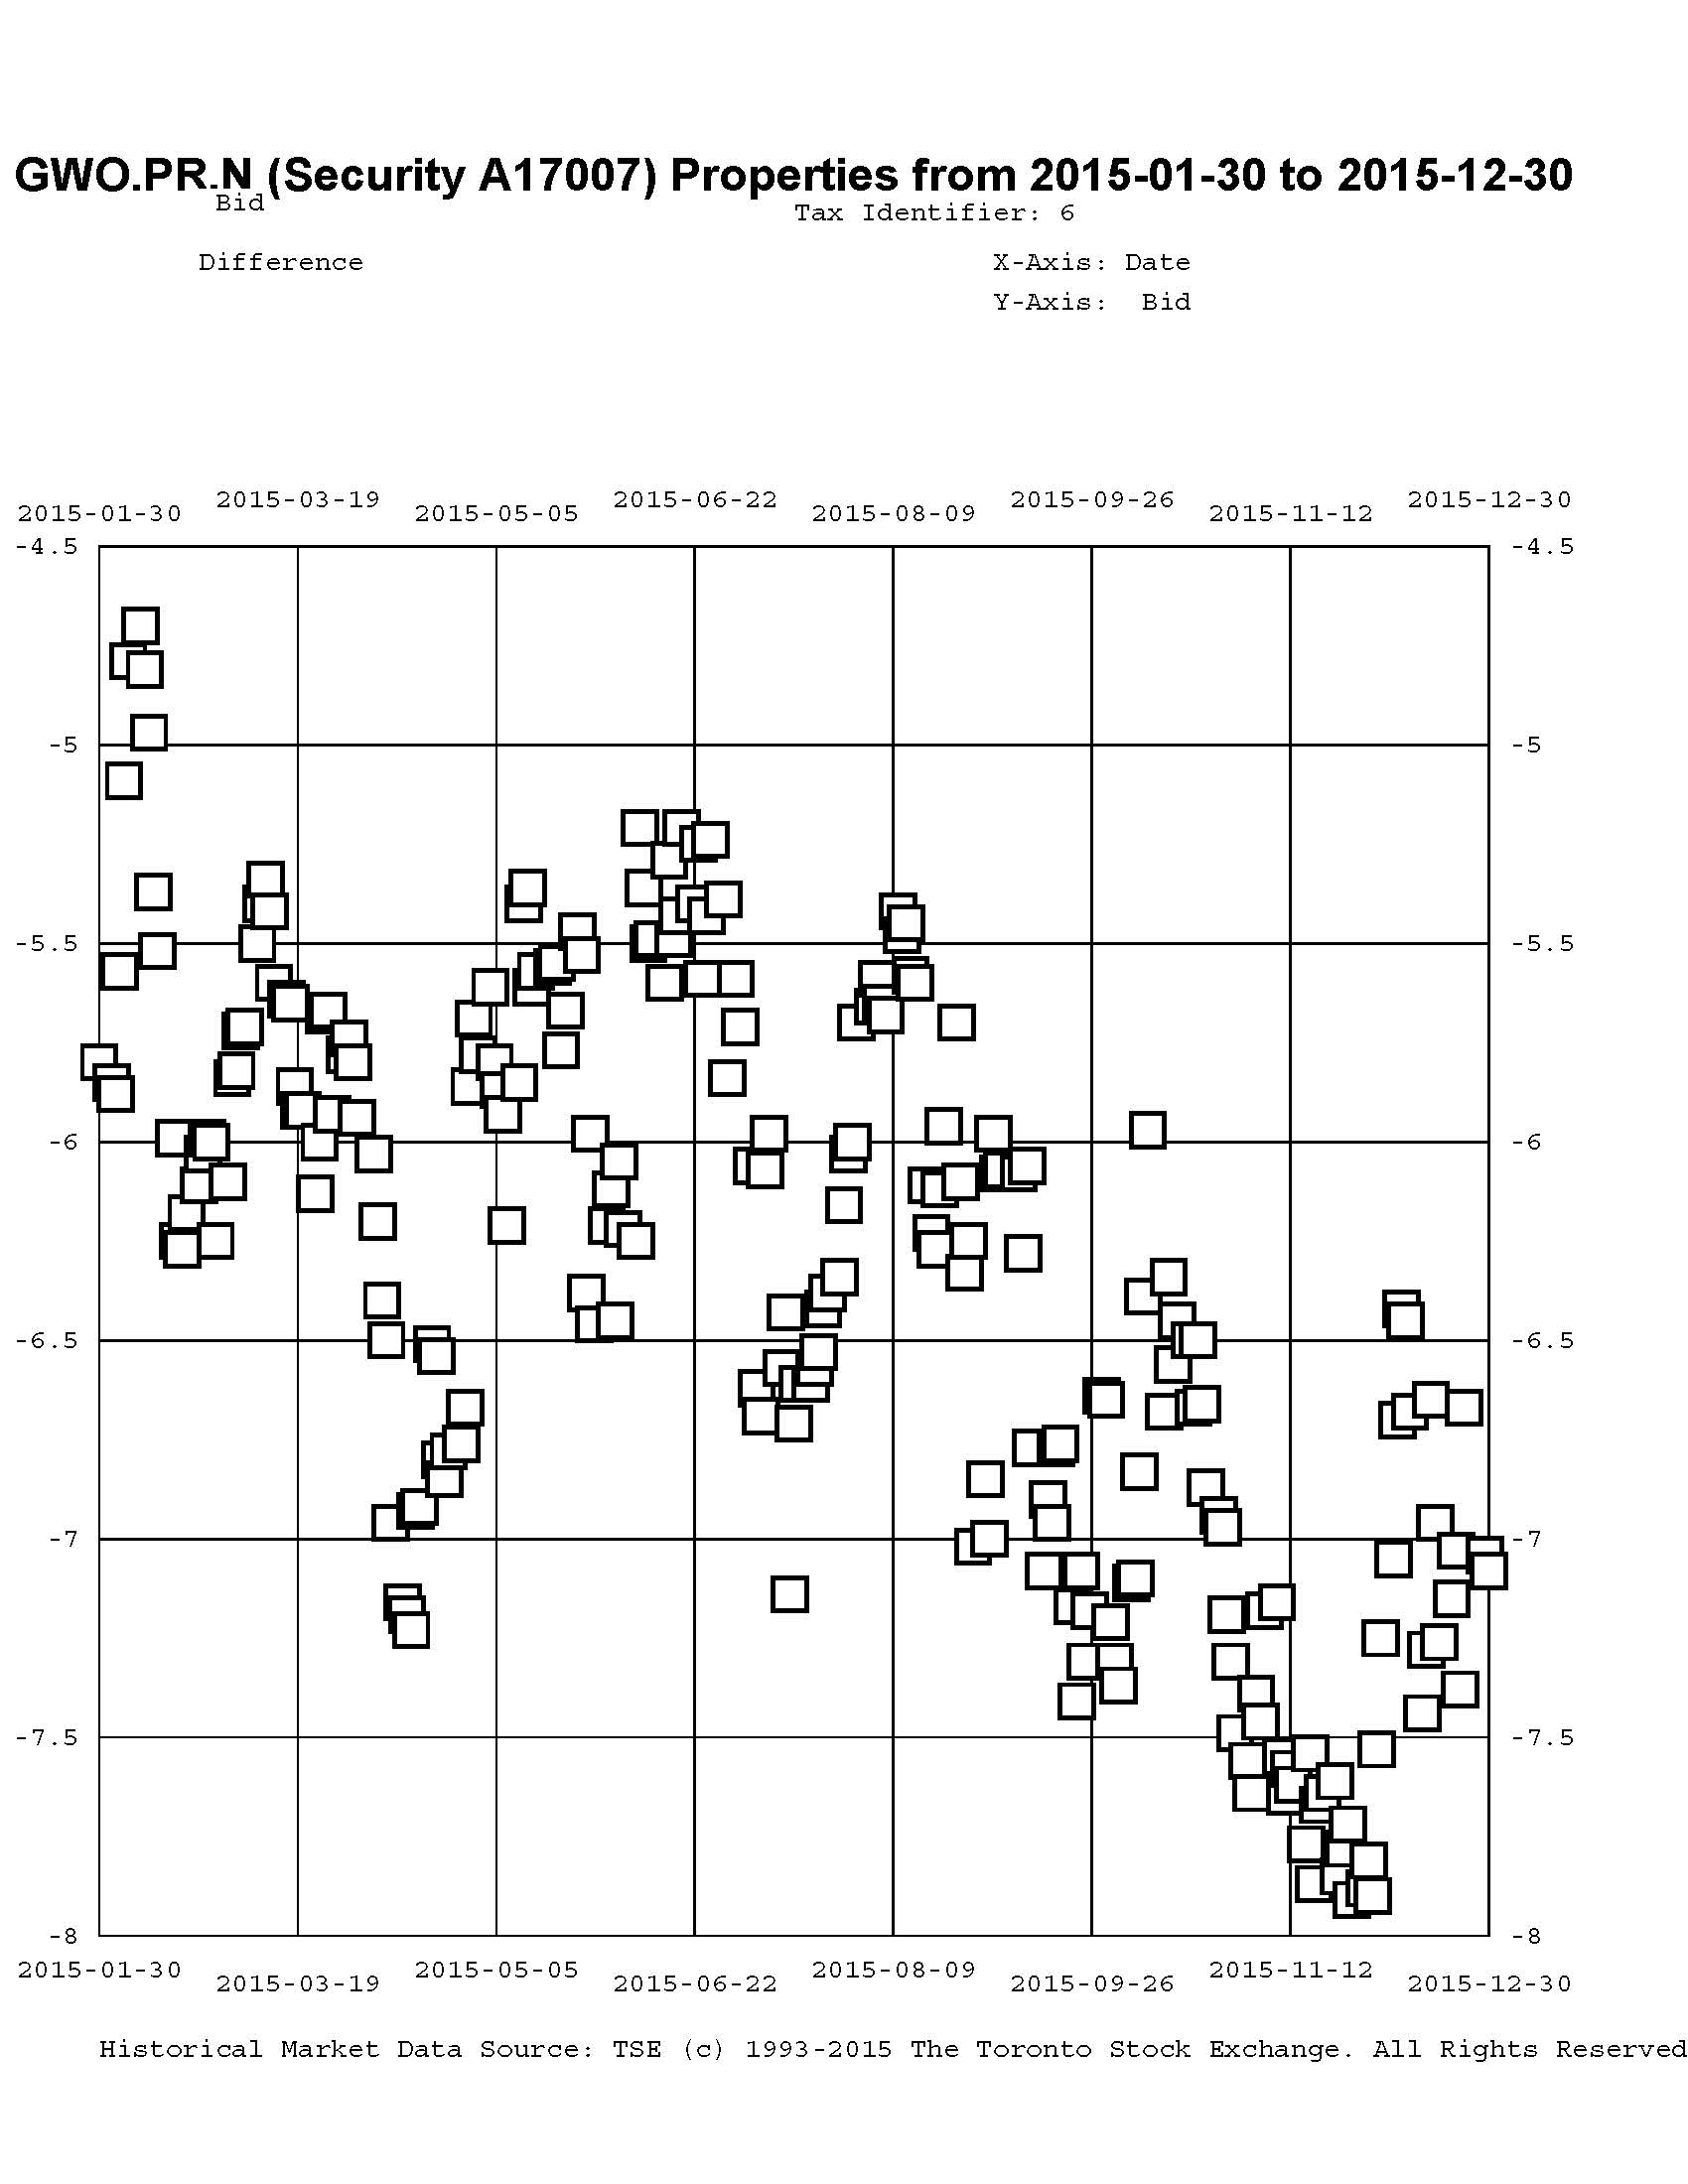
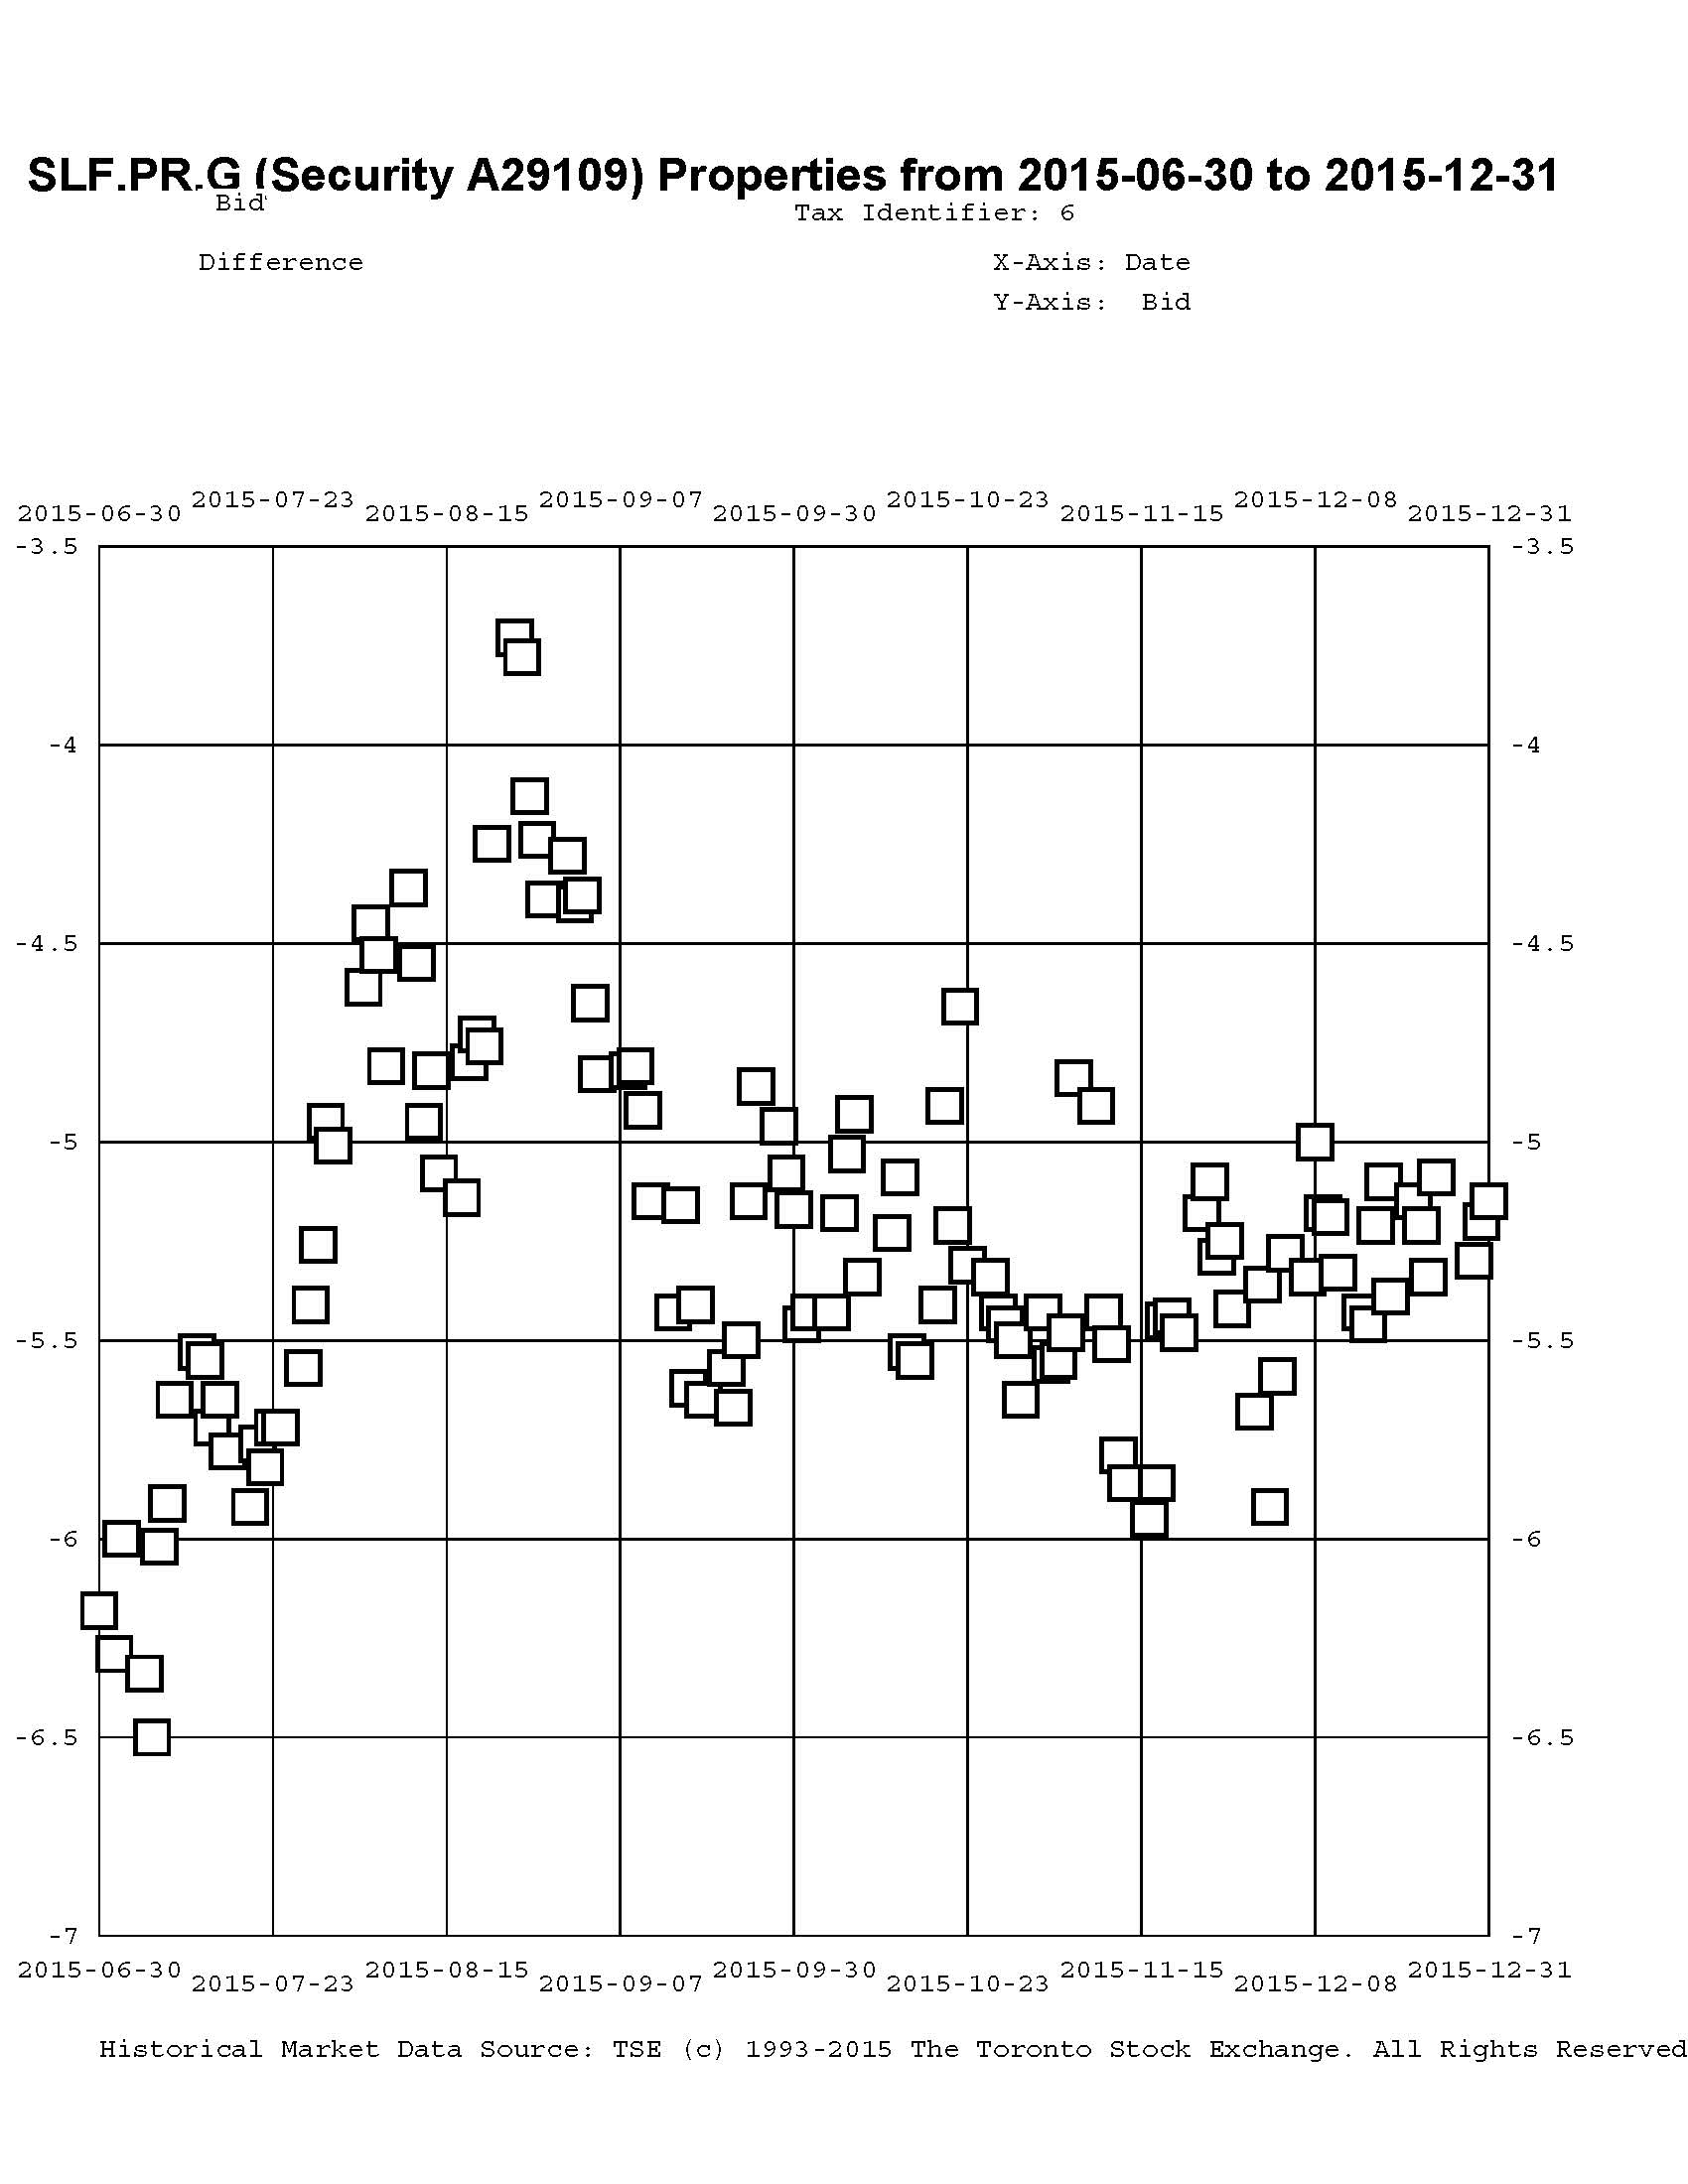
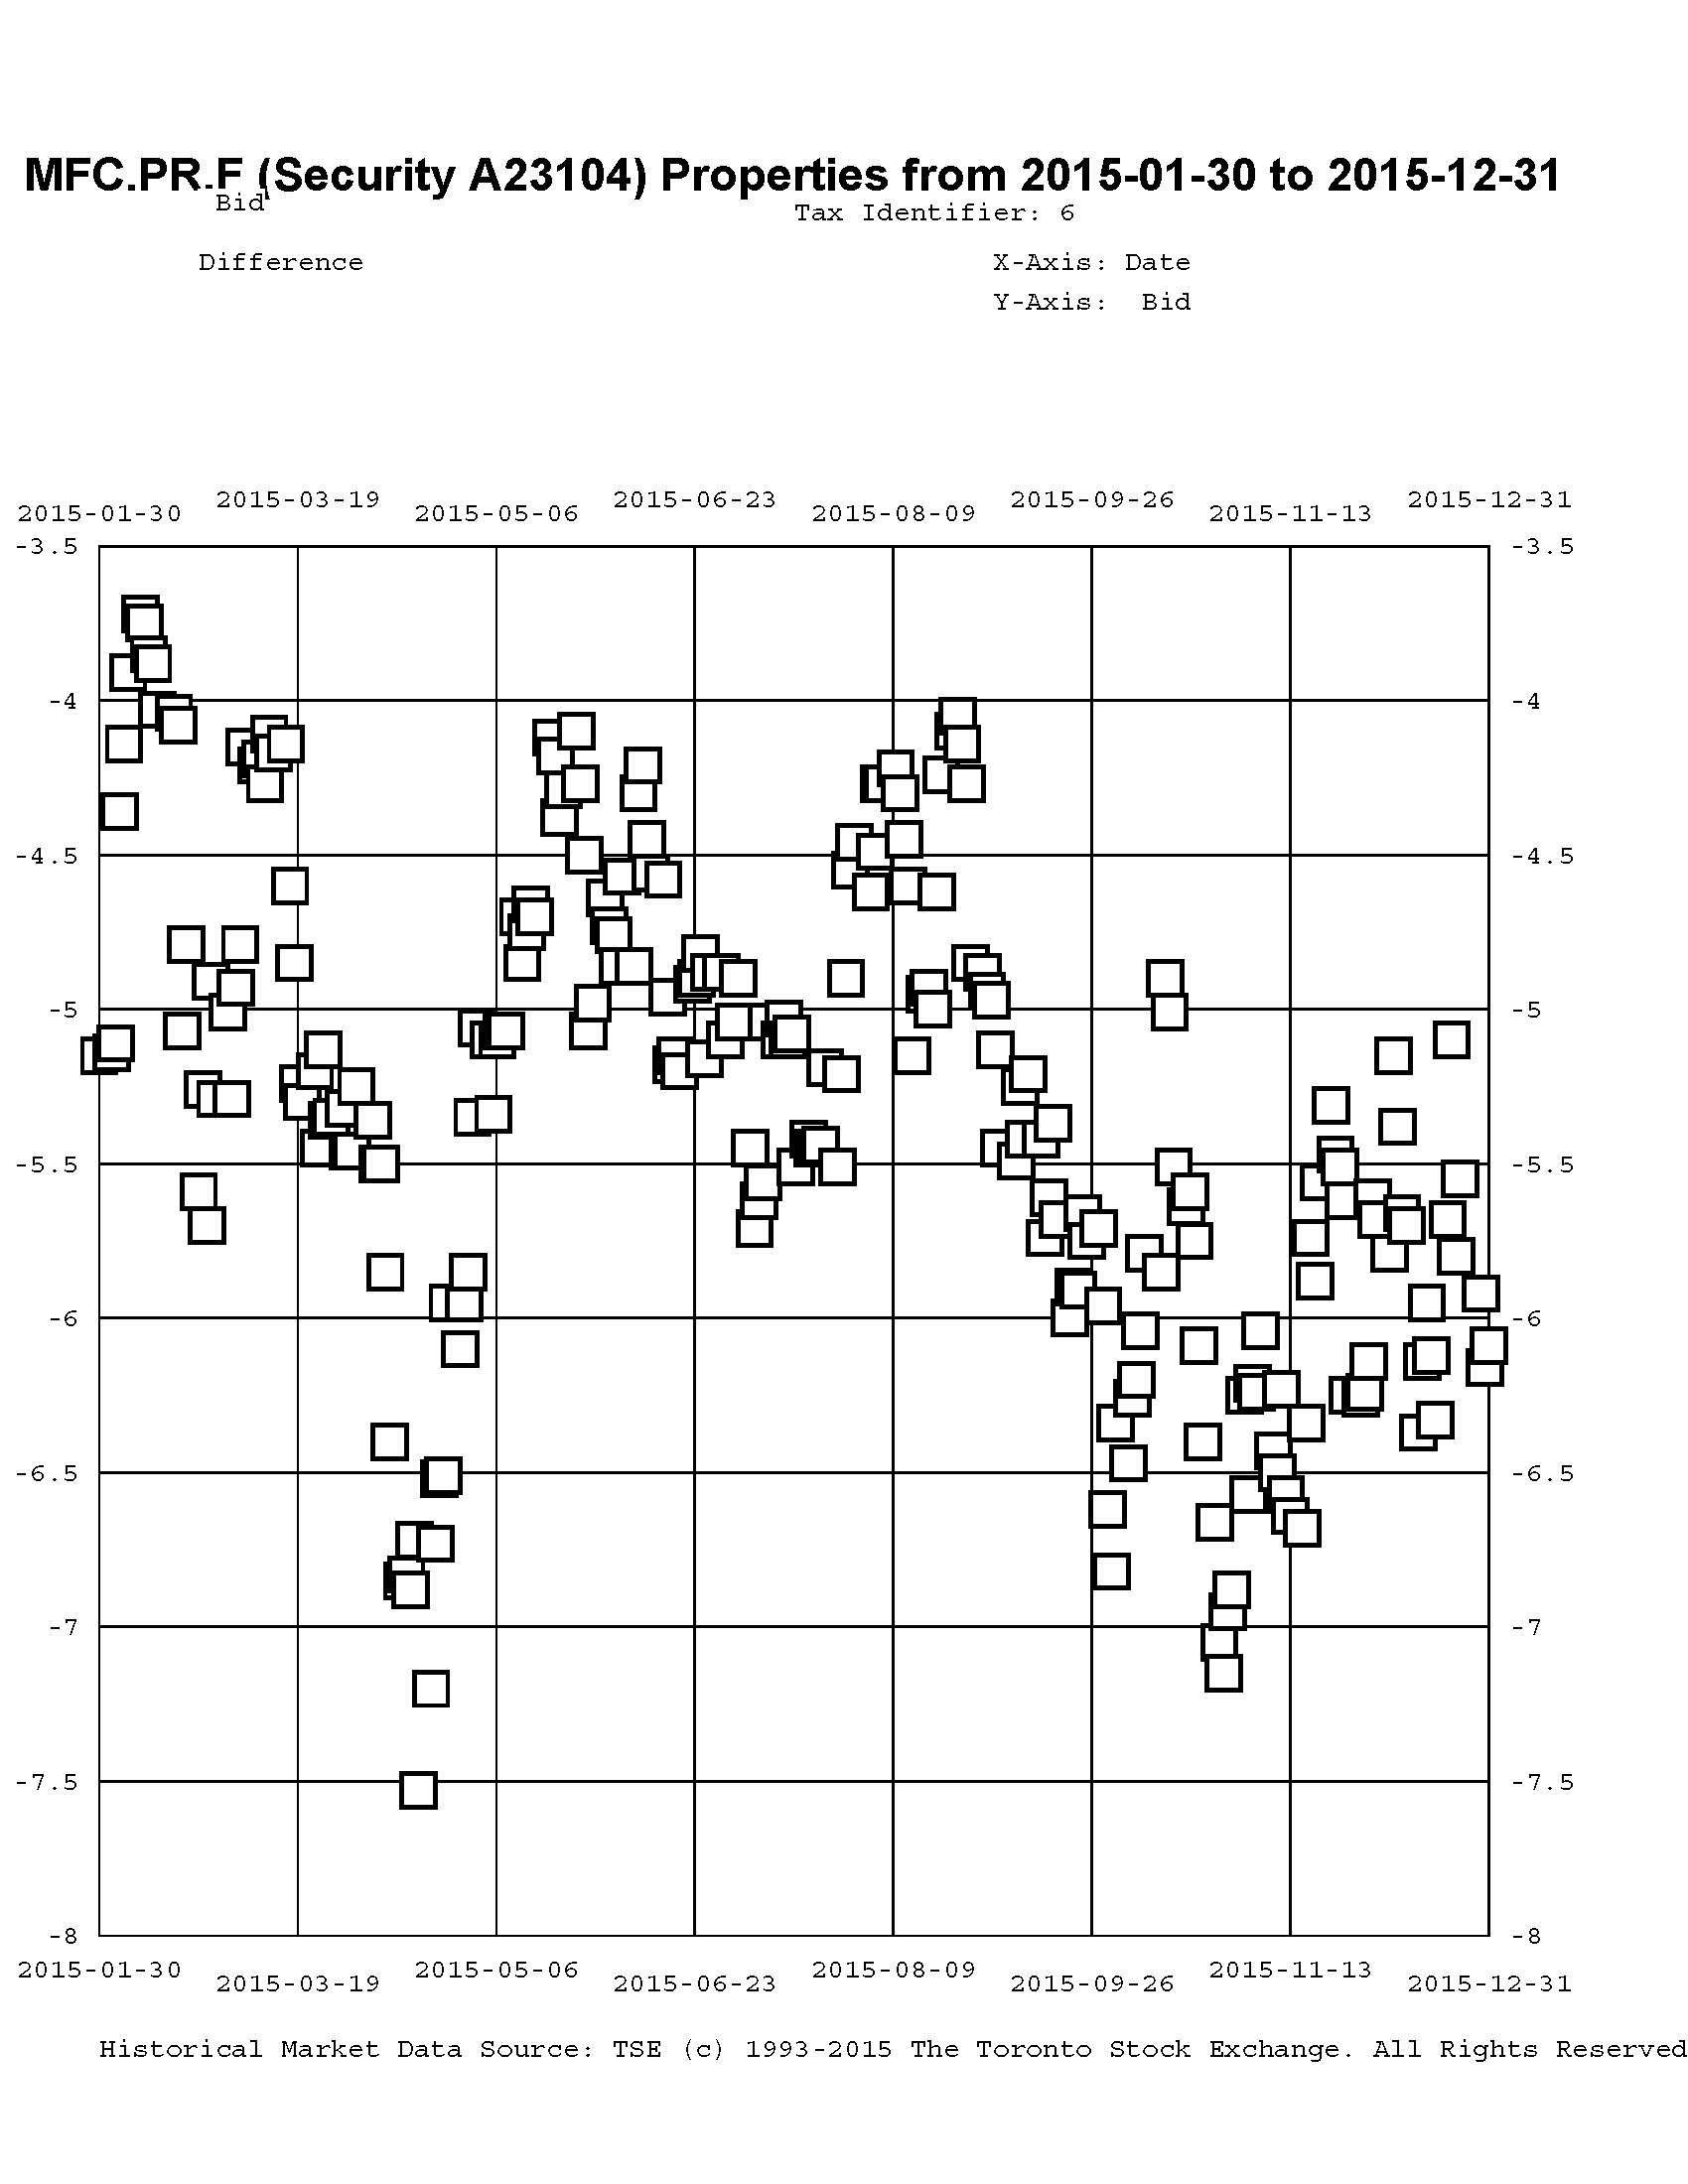
A problem that has bedevilled the market over the past four years has been the OSFI decision not to grandfather Straight Perpetuals as Tier 1 bank capital, and their continued foot-dragging regarding a decision on insurer Straight Perpetuals has segmented the market to the point where trading has become much more difficult. Until the market became so grossly segmented, there were many comparables for any given issue – but now banks are not available to swap into (because they are so expensive) and non-regulated companies are likewise deprecated (because they are not DeemedRetractibles; they should not participate in the increase in value that will follow the OSFI decision I anticipate and, in addition, are analyzed as perpetuals). The fund’s portfolio was, in effect ‘locked in’ to the low coupon DeemedRetractibles due to projected long-term gains from a future OSFI decision to the detriment of trading gains, particularly in May, 2013, when the three lowest-coupon SLF DeemedRetractibles (SLF.PR.C, SLF.PR.D and SLF.PR.E) were the worst performing DeemedRetractibles in the sub-index, and in June, 2013, when the insurance-issued DeemedRetractibles behaved like PerpetualDiscounts in a sharply negative market. Nowadays, the fund is ‘locked-in’ to the low-spread FixedResets from these companies: GWO.PR.N, MFC.PR.F, and SLF.PR.G.
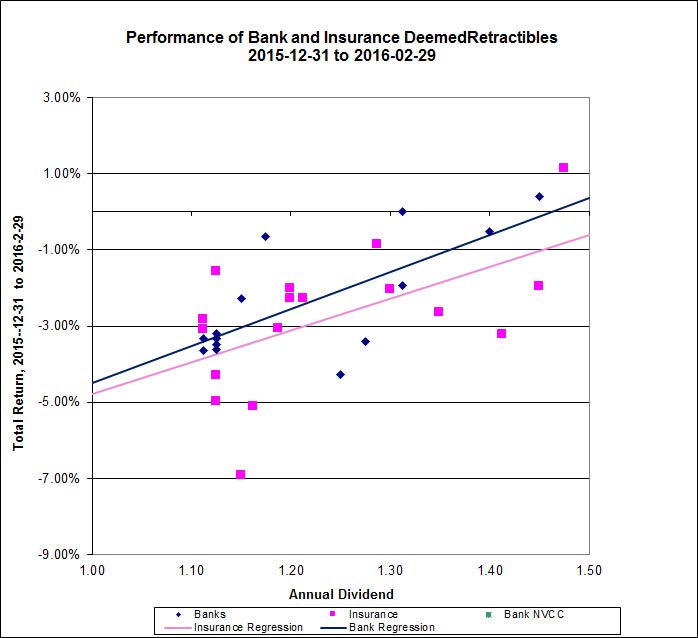
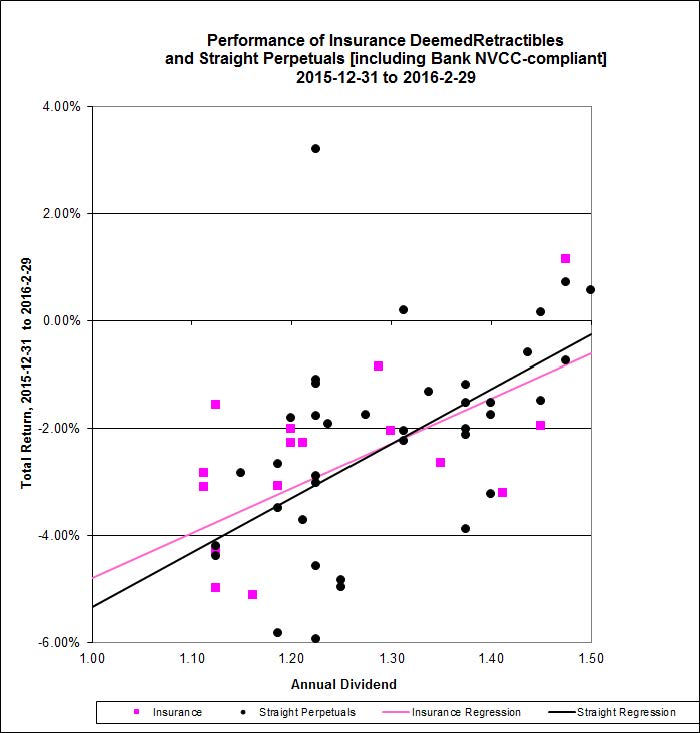
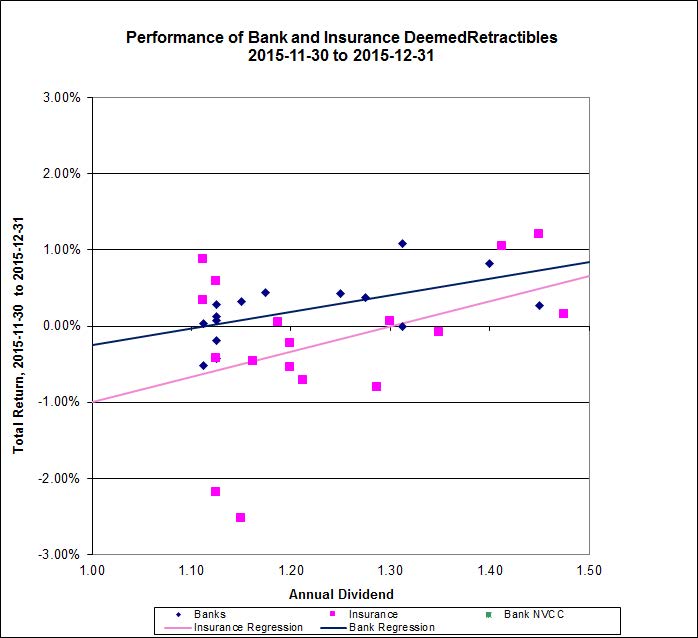
In December, insurance DeemedRetractibles underperformed bank DeemedRetractibles:
 Click for Big
… but outperformed Unregulated [and bank NVCC-compliant] Straight Perpetuals…
 Click for Big
Correlations were marginal for insurance DeemedRetractibles (11%), but decent for bank DeemedRetractibles (29%) and poor for unregulated/NVCC-compliant issues (0%, not shown).
Sometimes everything works … sometimes it’s 50-50 … sometimes nothing works. The fund seeks to earn incremental return by selling liquidity (that is, taking the other side of trades that other market participants are strongly motivated to execute), which can also be referred to as ‘trading noise’ – although for quite some time, noise trading has taken a distant second place to the sectoral play on insurance DeemedRetractibles; something that dismays me, particularly given that the market does not yet agree with me regarding the insurance issues! There were a lot of strongly motivated market participants during the Panic of 2007, generating a lot of noise! Unfortunately, the conditions of the Panic may never be repeated in my lifetime … but the fund will simply attempt to make trades when swaps seem profitable, without worrying about the level of monthly turnover.
What has happened over the past year has been – obviously, now! – a very significant re-pricing of the FixedReset market. My analytical software, HIMIPref™ assumes that the market is always right when it comes to pricing asset classes; it seeks to pick off the individual issues that stray too far from the normal price. Two years ago, FixedResets were yielding so little that the system didn’t see much value even in buying the mispriced ones – the weighting of FixedResets in the September, 2013, MAPF Portfolio Composition was only 8%. However, as the market drifted lower, the cheap outliers gradually became more and more attractive, and the weighting increased from 23.4% in the September, 2014, MAPF Portfolio Composition to its current figure of 70.2% in the September, 2015, MAPF Portfolio Composition. So … too early! But who would have thought that the market would be astonished in December, 2014, that the GOC-5 yields that have been so low for years could possibly have had an effect on dividends? Regrettably, when the entire market is blind, so are quantitative systems. Still, while relative performance has been poor lately, it hasn’t been disastrous … although some clients might feel that absolute performance has been quite disastrous enough, thank you very much.
There’s plenty of room for new money left in the fund. I have shown in PrefLetter that market pricing for FixedResets is very often irrational and I have lots of confidence – backed up by my bond portfolio management experience in the markets for Canadas and Treasuries, and equity trading on the NYSE & TSX – that there is enough demand for liquidity in any market to make the effort of providing it worthwhile (although the definition of “worthwhile” in terms of basis points of outperformance changes considerably from market to market!) I will continue to exert utmost efforts to outperform but it should be borne in mind that there will almost inevitably be periods of underperformance in the future.
The yields available on high quality preferred shares remain elevated, which is reflected in the current estimate of sustainable income.
| Calculation of MAPF Sustainable Income Per Unit |
| Month |
NAVPU |
Portfolio
Average
YTW |
Leverage
Divisor |
Securities
Average
YTW |
Capital
Gains
Multiplier |
Sustainable
Income
per
current
Unit |
| June, 2007 |
9.3114 |
5.16% |
1.03 |
5.01% |
1.3240 |
0.3524 |
| September |
9.1489 |
5.35% |
0.98 |
5.46% |
1.3240 |
0.3773 |
| December, 2007 |
9.0070 |
5.53% |
0.942 |
5.87% |
1.3240 |
0.3993 |
| March, 2008 |
8.8512 |
6.17% |
1.047 |
5.89% |
1.3240 |
0.3938 |
| June |
8.3419 |
6.034% |
0.952 |
6.338% |
1.3240 |
$0.3993 |
| September |
8.1886 |
7.108% |
0.969 |
7.335% |
1.3240 |
$0.4537 |
| December, 2008 |
8.0464 |
9.24% |
1.008 |
9.166% |
1.3240 |
$0.5571 |
| March 2009 |
$8.8317 |
8.60% |
0.995 |
8.802% |
1.3240 |
$0.5872 |
| June |
10.9846 |
7.05% |
0.999 |
7.057% |
1.3240 |
$0.5855 |
| September |
12.3462 |
6.03% |
0.998 |
6.042% |
1.3240 |
$0.5634 |
| December 2009 |
10.5662 |
5.74% |
0.981 |
5.851% |
1.1141 |
$0.5549 |
| March 2010 |
10.2497 |
6.03% |
0.992 |
6.079% |
1.1141 |
$0.5593 |
| June |
10.5770 |
5.96% |
0.996 |
5.984% |
1.1141 |
$0.5681 |
| September |
11.3901 |
5.43% |
0.980 |
5.540% |
1.1141 |
$0.5664 |
| December 2010 |
10.7659 |
5.37% |
0.993 |
5.408% |
1.0298 |
$0.5654 |
| March, 2011 |
11.0560 |
6.00% |
0.994 |
5.964% |
1.0298 |
$0.6403 |
| June |
11.1194 |
5.87% |
1.018 |
5.976% |
1.0298 |
$0.6453 |
| September |
10.2709 |
6.10%
Note |
1.001 |
6.106% |
1.0298 |
$0.6090 |
| December, 2011 |
10.0793 |
5.63%
Note |
1.031 |
5.805% |
1.0000 |
$0.5851 |
| March, 2012 |
10.3944 |
5.13%
Note |
0.996 |
5.109% |
1.0000 |
$0.5310 |
| June |
10.2151 |
5.32%
Note |
1.012 |
5.384% |
1.0000 |
$0.5500 |
| September |
10.6703 |
4.61%
Note |
0.997 |
4.624% |
1.0000 |
$0.4934 |
| December, 2012 |
10.8307 |
4.24% |
0.989 |
4.287% |
1.0000 |
$0.4643 |
| March, 2013 |
10.9033 |
3.87% |
0.996 |
3.886% |
1.0000 |
$0.4237 |
| June |
10.3261 |
4.81% |
0.998 |
4.80% |
1.0000 |
$0.4957 |
| September |
10.0296 |
5.62% |
0.996 |
5.643% |
1.0000 |
$0.5660 |
| December, 2013 |
9.8717 |
6.02% |
1.008 |
5.972% |
1.0000 |
$0.5895 |
| March, 2014 |
10.2233 |
5.55% |
0.998 |
5.561% |
1.0000 |
$0.5685 |
| June |
10.5877 |
5.09% |
0.998 |
5.100% |
1.0000 |
$0.5395 |
| September |
10.4601 |
5.28% |
0.997 |
5.296% |
1.0000 |
$0.5540 |
| December, 2014 |
10.5701 |
4.83% |
1.009 |
4.787% |
1.0000 |
$0.5060 |
| March, 2015 |
9.9573 |
4.99% |
1.001 |
4.985% |
1.0000 |
$0.4964 |
| June, 2015 |
9.4181 |
5.55% |
1.002 |
5.539% |
1.0000 |
$0.5217 |
| September, 2015 |
7.8140 |
6.98% |
0.999 |
6.987% |
1.0000 |
$0.5460 |
| December, 2015 |
8.1379 |
6.85% |
0.997 |
6.871% |
1.0000 |
$0.5592 |
NAVPU is shown after quarterly distributions of dividend income and annual distribution of capital gains.
Portfolio YTW includes cash (or margin borrowing), with an assumed interest rate of 0.00%
The Leverage Divisor indicates the level of cash in the account: if the portfolio is 1% in cash, the Leverage Divisor will be 0.99
Securities YTW divides “Portfolio YTW” by the “Leverage Divisor” to show the average YTW on the securities held; this assumes that the cash is invested in (or raised from) all securities held, in proportion to their holdings.
The Capital Gains Multiplier adjusts for the effects of Capital Gains Dividends. On 2009-12-31, there was a capital gains distribution of $1.989262 which is assumed for this purpose to have been reinvested at the final price of $10.5662. Thus, a holder of one unit pre-distribution would have held 1.1883 units post-distribution; the CG Multiplier reflects this to make the time-series comparable. Note that Dividend Distributions are not assumed to be reinvested.
Sustainable Income is the resultant estimate of the fund’s dividend income per current unit, before fees and expenses. Note that a “current unit” includes reinvestment of prior capital gains; a unitholder would have had the calculated sustainable income with only, say, 0.9 units in the past which, with reinvestment of capital gains, would become 1.0 current units. |
| DeemedRetractibles are comprised of all Straight Perpetuals (both PerpetualDiscount and PerpetualPremium) issued by BMO, BNS, CM, ELF, GWO, HSB, IAG, MFC, NA, RY, SLF and TD, which are not exchangable into common at the option of the company (definition refined in May, 2011). These issues are analyzed as if their prospectuses included a requirement to redeem at par on or prior to 2022-1-31 (banks) or 2025-1-31 (insurers and insurance holding companies), in addition to the call schedule explicitly defined. See OSFI Does Not Grandfather Extant Tier 1 Capital, CM.PR.D, CM.PR.E, CM.PR.G: Seeking NVCC Status and the January, February, March and June, 2011, editions of PrefLetter for the rationale behind this analysis.
The same reasoning is also applied to FixedResets from these issuers, other than explicitly defined NVCC from banks. |
| Yields for September, 2011, to January, 2012, were calculated by imposing a cap of 10% on the yields of YLO issues held, in order to avoid their extremely high calculated yields distorting the calculation and to reflect the uncertainty in the marketplace that these yields will be realized. From February to September 2012, yields on these issues have been set to zero. All YLO issues held were sold in October 2012. |
| Calculations of resettable instruments are performed assuming constant contemporary GOC-5 and 3-Month Bill rates. For September 30, 2015, yields of 0.78% and 0.40%, respectively, were assumed; base rates in November, 2015, were 0.71% and 0.46%, respectively. |
Significant positions were held in DeemedRetractible, SplitShare and NVCC non-compliant regulated FixedReset issues on December 31; all of these currently have their yields calculated with the presumption that they will be called by the issuers at par prior to 2022-1-31 (banks) or 2025-1-31 (insurers and insurance holding companies) or on a different date (SplitShares) This presents another complication in the calculation of sustainable yield, which also assumes that redemption proceeds will be reinvested at the same rate.
I will also note that the sustainable yield calculated above is not directly comparable with any yield calculation currently reported by any other preferred share fund as far as I am aware. The Sustainable Yield depends on:
i) Calculating Yield-to-Worst for each instrument and using this yield for reporting purposes;
ii) Using the contemporary value of Five-Year Canadas to estimate dividends after reset for FixedResets. The assumption regarding the five-year Canada rate has become more important as the proportion of low-spread FixedResets in the portfolio has increased.
iii) Making the assumption that deeply discounted NVCC non-compliant issues from both banks and insurers, both Straight and FixedResets will be redeemed at par on their DeemedMaturity date as discussed above.
I no longer show calculations that assume the conversion of the entire portfolio into PerpetualDiscounts, as the fund has only a small position in these issues.
Most funds report Current Yield or Distribution Yield. For instance, ZPR reports a “Distribution Yield” of 6.19% as of January 8, 2016, but this is a meaningless number: “The most recent regular distribution (excluding year end distributions for those ETFs that distribute more frequently) annualized for frequency divided by current NAV.”. Thus, dividend cuts expected in the next five years are ignored. It’s meaningless; to discuss it in the context of portfolio reporting is misleading.
iShares reports the “12m Trailing Yield”, which is the sum of the past year’s distributions divided by the current price: meaningless. They also report the “Distribution Yield”, which has the same definition as does ZPR: meaningless.
As for MAPF … I will not attempt to mislead my customers with meaningless figures, nor will I spend the time required to bring the reporting of rinky-dink shops like BMO and Blackrock up to more professional standards. I will continue to calculate the best metric I can think of and report that to you with full explanations.
It should be noted that the concept of this Sustainable Income calculation was developed when the fund’s holdings were overwhelmingly PerpetualDiscounts – see, for instance, the bottom of the market in November 2008. It is easy to understand that for a PerpetualDiscount, the technique of multiplying yield by price will indeed result in the coupon – a PerpetualDiscount paying $1 annually will show a Sustainable Income of $1, regardless of whether the price is $24 or $17.
Things are not quite so neat when maturity dates and maturity prices that are different from the current price are thrown into the mix. If we take a notional Straight Perpetual paying $5 annually, the price is $100 when the yield is 5% (all this ignores option effects). As the yield increases to 6%, the price declines to 83.33; and 83.33 x 6% is the same $5. Good enough.
But a ten year bond, priced at 100 when the yield is equal to its coupon of 5%, will decline in price to 92.56; and 92.56 x 6% is 5.55; thus, the calculated Sustainable Income has increased as the price has declined as shown in the graph:
 Click for Big
The difference is because the bond’s yield calculation includes the amortization of the discount; therefore, so does the Sustainable Income estimate.
Different assumptions lead to different results from the calculation, but the overall positive trend is apparent. I’m very pleased with the long-term results! It will be noted that if there was no trading in the portfolio, one would expect the sustainable yield to be constant (before fees and expenses). The success of the fund’s trading is showing up in
- the very good performance against the index
- the long term increases in sustainable income per unit
As has been noted, the fund has maintained a credit quality equal to or better than the index; outperformance has generally been due to exploitation of trading anomalies.
Again, there are no predictions for the future! The fund will continue to trade between issues in an attempt to exploit market gaps in liquidity, in an effort to outperform the index and keep the sustainable income per unit – however calculated! – growing.