There’s an interesting piece on Bloomberg about a guy who exploits death-spiral financing:
What Sason discovered is a way to get shares in desperate and broke companies at big discounts by lending them money. Magna has done deals with at least 80 companies. Of those, the stocks of 71 have gone down since the investment. He can still turn a profit, because the terms of the deals allow him to turn debt into equity at a fixed discount. No matter where the stock is trading, he gets it for less.
Magna functions as a pawnshop for penny stocks—shares of obscure ventures that change hands far from the rules of the New York Stock Exchange. His customers have included a would-be Chilean copper miner, an inventor of thought-controlled phones, and at least two executives later busted for fraud. They come to Sason to trade a lot of their stock for a little bit of money. Often they’re aware the deal is likely to be bad for their shareholders.
If the share price goes lower before Magna can unload its investment, the companies have to give up even more stock, all but eliminating the risk for Sason. Critics call it “death-spiral financing” because it drives stocks into the ground. Others in the field say they sometimes make double, triple, or even 10 times their investment in just a few months.
The business is legal, but the loopholes in securities law it exploits are too sketchy for most of the Ivy League types at banks and hedge funds. At least six other lenders of last resort to penny-stock companies have been sued by the Securities and Exchange Commission for breaking the rules around dumping shares or other violations. One was arrested by the FBI. It’s worked out better for Sason, who hasn’t had any issues with the authorities. He’s using death-spiral profits to diversify Magna and turn himself into an entertainment mogul.
Kevin Carmichael of the Centre for International Governance Innovation (last mentioned on PrefBlog on December 30, 2014) writes a piece in the Globe titled The most alarming thing about Canada’s housing market is routinely ignored:
So Royal Bank of Canada chief executive David McKay thinks Canada’s housing market is just fine. That’s reassuring, to a point. It would be more so if Canada had a public authority in place to verify Mr. McKay’s confidence. The fact there is no such entity undermines Ottawa’s belief that it has something to teach the world about financial regulation.
…
But the bigger moral hazard is Canada’s housing policy. Most Canadian mortgages are insured, and that insurance is backed by the federal government. There is little reason for a banker to worry much about warning lights in a system like that. In fact, it is a selling point. “What we keep trying to educate is our first loss is covered by government guaranteed insurance,” Mr. McKay said.In other words, if you are thinking about buying RBC stock, no need to assume the bank would suffer big losses in the event of a housing crash: it will be taxpayers who take the hit. Mr. McKay and the leaders of Canada’s other big banks can make bets on the positive indicators – and play down the bad stuff – because they have relatively little to lose. They have every incentive to go all in on housing – and they have. The chartered banks are holding almost $1-trillion in outstanding residential credit, according to Bank of Canada data.
So there are two problems with this. First, there is no ‘moral hazard associated with CMHC insurance. Moral hazard is the assumption that you’ll be rescued if things go wrong. With CMHC insurance this opprobrious term does not apply because it’s not an assumption. It’s a business transaction. The banks – or their clients – have paid for insurance and are entitled to the benefits of that insurance. Now, one may argue that the insurance is priced too low, or shouldn’t be made so freely available, or anything else you please, but to claim that this is an example of “moral hazard” is to misuse the term.
But the big problem is Mr. Carmichael’s belief that we need a fresh new batch of expensive regulators to tell us when houses are expensive.
There is no single entity that is in charge of deflating the asset-price bubbles that turn into busts if left unchecked. The Bank of Canada has no regulatory power. It could adjust interest rates, but that is a blunt response to a potential bubble in housing, farmland or some other asset. The priority of the Office of the Superintendent of Financial Institutions is making sure none of the big banks fail, not keeping an eye for other weak spots in the broader financial system. That job technically falls to the Finance Department, which, until Canada starts appointing technocrats to run its ministries, will inevitably be controlled by a politician. And a politician always will have an incentive to avoid unpopular decisions such as making it more difficult to buy a home.
The big assumption here is that wise bureaucrats can identify asset bubbles better than anybody else, since mystic infallibility is a perquisite of government employees. This assumption has been discussed in the States, where (in contrast to Canada) public discussion of actual issues by those who might be expected to have some kind of clue is encouraged … for instance, by Ben Bernanke in 2002, when he was a mere Fed governor and not the chair:
My talk today will address a contentious issue, summarized by the following pair of questions: Can the Federal Reserve (or any central bank) reliably identify “bubbles” in the prices of some classes of assets, such as equities and real estate? And, if it can, what if anything should it do about them?
…
As I will argue today, I think for the Fed to be an “arbiter of security speculation or values” is neither desirable nor feasible.1 Of course, to do its job the Fed must monitor financial markets intensively and continuously. The financial markets are vital components of the economic machinery. Moreover, asset prices contain an enormous amount of useful and timely information about developments in the broader economy, information that should certainly be taken into account in the setting of monetary policy. For example, to the extent that a stock-market boom causes, or simply forecasts, sharply higher spending on consumer goods and new capital, it may indicate incipient inflationary pressures. Policy tightening might therefore be called for–but to contain the incipient inflation not to arrest the stock-market boom per se.2The second part of my prescription is for the Fed to use its regulatory, supervisory, and lender-of-last-resort powers to protect and defend the financial system. In particular, alone and in concert with other agencies, the Fed should ensure that financial institutions and markets are well prepared for the contingency of a large shock to asset prices. The Fed and other regulators should insist that banks be well capitalized and well diversified and that they stress-test their portfolios against a wide range of scenarios. The Fed can also contribute to reducing the probability of boom-and-bust cycles occurring in the first place, by supporting such objectives as more-transparent accounting and disclosure practices and working to improve the financial literacy and competence of investors.3 Finally, if a sudden correction in asset prices does occur, the Fed’s first responsibility is to do its part to ensure the integrity of the financial infrastructure–in particular, the payments system and the systems for settling trades of securities and other financial instruments. If necessary, the Fed should provide ample liquidity until the immediate crisis has passed. The Fed’s response to the 1987 stock market break is a good example of what I have in mind.4
…
If we could accurately and painlessly rid asset markets of bubbles, of course we would want to do so. But as a practical matter, this is easier said than done, particularly if we intend to use monetary policy as the instrument, for two main reasons. First, the Fed cannot reliably identify bubbles in asset prices. Second, even if it could identify bubbles, monetary policy is far too blunt a tool for effective use against them.
Wise words indeed! We cannot identify asset bubbles with any more reliability than we can indulge in any other form of market timing, but what we can do is perform stress tests and explore what-if scenarios to examine risks to the financial system.
Next up is Fed Governor Frederic S. Mishkin in a 2008 speech titled How Should We Respond to Asset Price Bubbles?:
At some point, however, the bubble bursts. The collapse in asset prices then leads to a reversal of the feedback loop in which loans go sour, lenders cut back on credit supply, the demand for the assets declines further, and prices drop even more. The resulting loan losses and declines in asset prices erode the balance sheets at financial institutions, further diminishing credit and investment across a broad range of assets. The decline in lending depresses business and household spending, which weakens economic activity and increases macroeconomic risk in credit markets.5 In the extreme, the interaction between asset prices and the health of financial institutions following the collapse of an asset price bubble can endanger the operation of the financial system as a whole.6
To be clear, not all asset price bubbles create these risks to the financial system. For example, the bubble in technology stocks in the late 1990s was not fueled by a feedback loop between bank lending and rising equity values; indeed, the bursting of the tech-stock bubble was not accompanied by a marked deterioration in bank balance sheets. But potential for some asset price bubbles to create larger difficulties for the financial system than others implies that our regulatory framework should be designed to address the potential challenges to the financial system created by these bubbles.
…
More generally, our approach to regulation should favor policies that will help prevent future feedback loops between asset price bubbles and credit supply. A few broad principles are helpful in thinking about what such policies should look like. First, regulations should be designed with an eye toward fixing market failures. Second, regulations should be designed so as not to exacerbate the interaction between asset price bubbles and credit provision. For example, research has shown that the rise in asset values that accompanies a boom results in higher capital buffers at financial institutions, supporting further lending in the context of an unchanging benchmark for capital adequacy; in the bust, the value of this capital can drop precipitously, possibly even necessitating a cut in lending.15 It is important for research to continue to analyze the role of bank capital requirements in promoting financial stability, including whether capital requirements should be adjusted over the business cycle or whether other changes in our regulatory structure are necessary to ensure macroeconomic efficiency.16 Finally, in general, regulatory policies are appropriately focused on the soundness of individual institutions. However, during certain periods, risks across institutions become highly correlated, and we need to consider whether such policies might need to take account of these higher-stress environments in assessing the resilience of both individual institutions and the financial system as a whole in the face of potential external shocks.
Again, this is good stuff essentially reiterating the thrust of the Bernanke speech with the benefit of some experience and supporting my contentions.
Under Yellen, however, we seem to be moving at least somewhat in the other direction:
The Federal Reserve has created a committee led by Vice Chairman Stanley Fischer to monitor financial stability, reinforcing its efforts to avoid the emergence of asset-price bubbles.
Joining Fischer on the Committee on Financial Stability are Governors Daniel Tarullo and Lael Brainard, according to the central bank’s latest Board Committee list.
Fed officials want to ensure that six years of near-zero interest rates don’t lead to a repeat of the excessive risk-taking that fanned the U.S. housing boom and subsequent financial crisis.
“They’re putting the varsity team on it, but whether or not they’re going to be able to call bubbles better than anyone else is really is an open question,” Drew Matus, deputy U.S. chief economist at UBS Securities LLC in New York, said in an interview yesterday.
As I have said before, I don’t think any bureaucrat has the ability to determine whether or not housing prices are too high or too low and should not have the ability to target them. To consider the question to bark up the wrong tree. The critical question is (in the context of Mr. Carmichael’s article) ‘what might happen if housing prices give up all their real (inflation adjusted) gains from the past ten years in the next year or two?’ What’s that risk and are the probable consequences of such a bust sufficiently horrific that Something Must Be Done?
I have proposed in the past and will continue to propose that banks’ asset mix be an important input into countercyclical capital requirements. For instance, Canadian banks now have about 40% of their assets in mortgages compared to a long term average of 30%. While I have no idea what the “proper” proportion might be (maybe 60% is the magic number!) I do know that this represents a change and that change may be good and may be bad but is always risky. So, I say, it should be OSFI who, in such a situation, tells the banks … ‘OK. For the first 30% of your assets that are mortgages, capital requirements are the same as they always have been. But on the next 5% of mortgage assets, capital requirements are surcharged by 50%. On any amount over 35%, surcharged 100%’. Such a regime allows the banks to conduct business according to profitability, while making ‘excess’ business a little less profitable because it needs more capital.
And, of course, the big villain here is not the inability of the federal government to appoint a House Price Approval Commission, but their fuelling of the fire with massively expanded CMHC guarantees. And, I will note, I discussed on December 27, 2012 the response of David Dodge (the last independent Bank of Canada governor) to the reckless expansion of the CMHC, as quoted by the Globe and Mail in a piece titled Ottawa’s $800-billion housing problem:
It was a sweltering afternoon in July, 2006, and David Dodge was meeting with executives at Canada Mortgage and Housing Corp. in Ottawa, in search of the answer to a pressing question: Why were they lowering their standards in such a reckless fashion?
…
Now CMHC was abandoning its old ways. It was starting to allow more exotic kinds of mortgages, similar to what lenders were offering in the United States – 35-year loans, and loans on which the buyers had to pay only the interest at first, giving them low monthly payments at first but saddling them with more debt down the road.To Mr. Dodge, these were irresponsible moves that would encourage some people to borrow too much or jump into the market before they were ready, creating new risks for the economy. “This is a mistake,” he told CMHC brass bluntly.
Lower mortgage standards were going to cause already-frothy house prices to inflate even more – an “excessive exuberance,” the governor called it – as buyers rushed in, borrowing greater amounts of money and purchasing bigger homes than they could otherwise afford.
“This is absolutely not the appropriate thing to do,” a frustrated Mr. Dodge told the meeting.
Yep, Mr. Dodge knew his business all right. Last of a dying breed.
However … say what you like about financial industry regulation, there’s no denying it’s an effective form of foreign aid:
It’s noon inside the offices of ForexChile in Santiago, and dozens of salespeople are working the phones, talking up investments linked to everything from Facebook stock to copper futures. They hold out tantalizing prospects to those on the other end of the line: potential returns of 20 percent, 30 percent, even 40 percent.
Familiar, yes — and illegal if this were the U.S. Because what these people are selling are neither stocks nor bonds nor futures nor funds. They are offering contracts for difference, financial derivatives that are off-limits to retail investors in the U.S. and highly regulated elsewhere.
The scene unfolds daily inside one of the most fashionable business addresses in Chile, where the contracts are perfectly legal and trading in them has exploded. BEFX, another brokerage that sells them, estimates that as much as $14 billion in leveraged trades are made every month. That’s about six times the turnover in the nation’s stocks.
It was a violently mixed day for the Canadian preferred share market, with PerpetualDiscounts losing 41bp, FixedResets up 21bp and DeemedRetractibles gaining 7bp. The Performance Highlights table is dominated by winning FixedResets. Volume was only average – somewhat surprisingly, since I would have expected four new issue settlements in four days to have caused a lot of churn. Well – we’ll see what tomorrow will bring, with the settlement of the new Royal Bank FixedReset, 3.60%+262.
For as long as the FixedReset market is so violently unsettled, I’ll keep publishing updates of the more interesting and meaningful series of FixedResets’ Implied Volatilities. This doesn’t include Enbridge because although Enbridge has a large number of issues outstanding, all of which are quite liquid, the range of Issue Reset Spreads is too small for decent conclusions. The low is 212bp (ENB.PR.H; second-lowest is ENB.PR.D at 237bp) and the high is a mere 268 for ENB.PF.G.
Remember that all rich /cheap assessments are:
» based on Implied Volatility Theory only
» are relative only to other FixedResets from the same issuer
» assume constant GOC-5 yield
» assume constant Implied Volatility
» assume constant spread
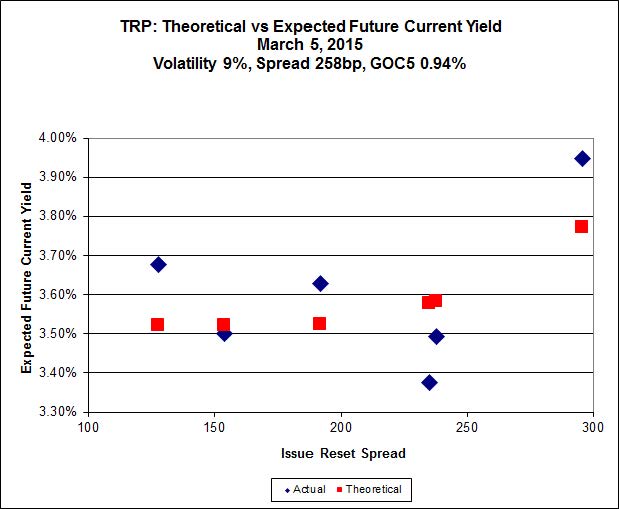
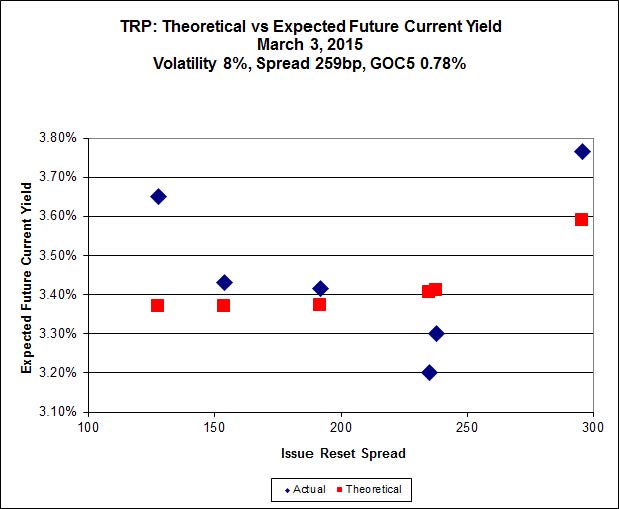
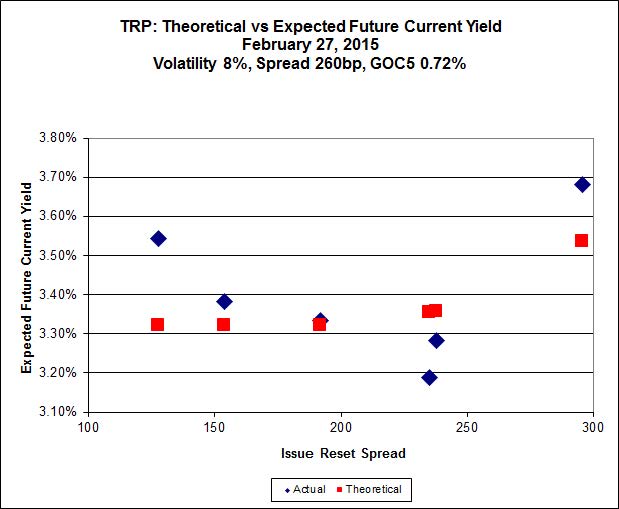
Here’s TRP:
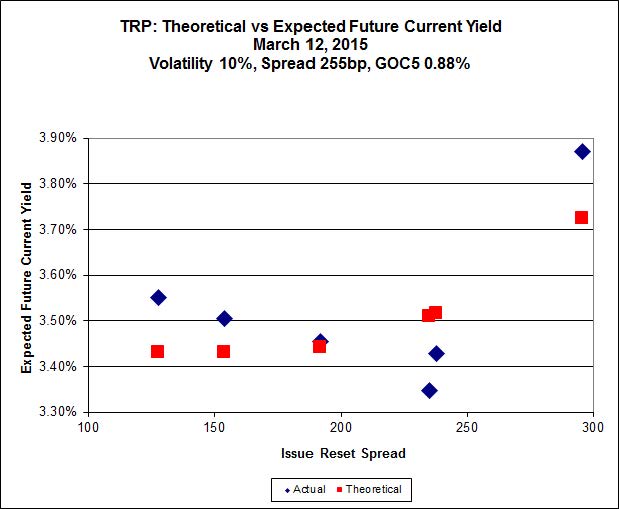
Click for Big
TRP.PR.E, which resets 2019-10-30 at +235, is bid at 24.12 to be $1.12 rich, while TRP.PR.G, resetting 2020-11-30 at +296, is $0.98 cheap at its bid price of 24.80.
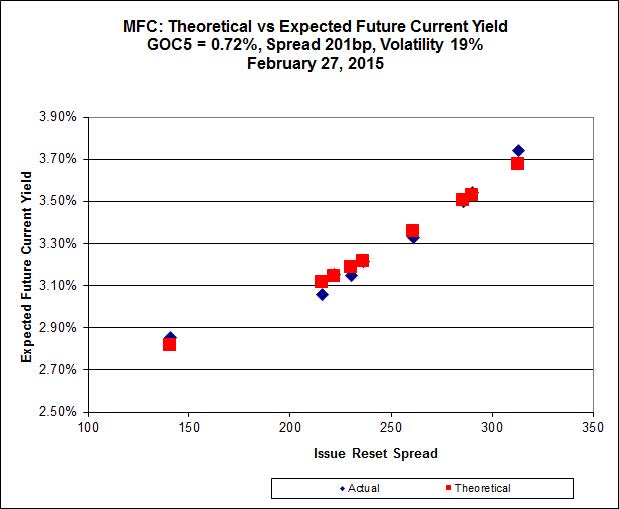
Click for Big
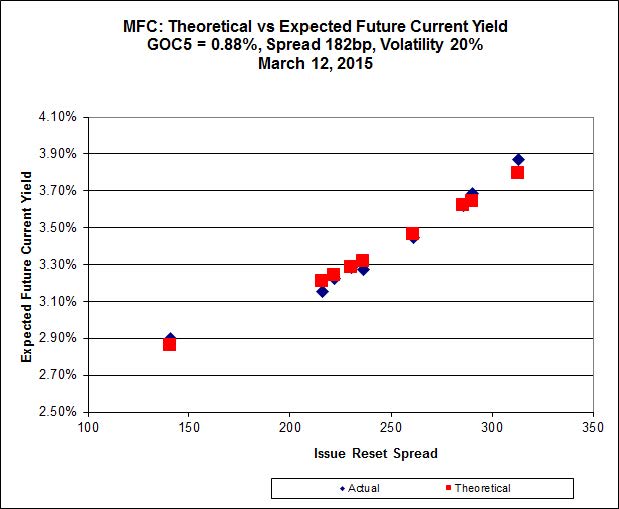
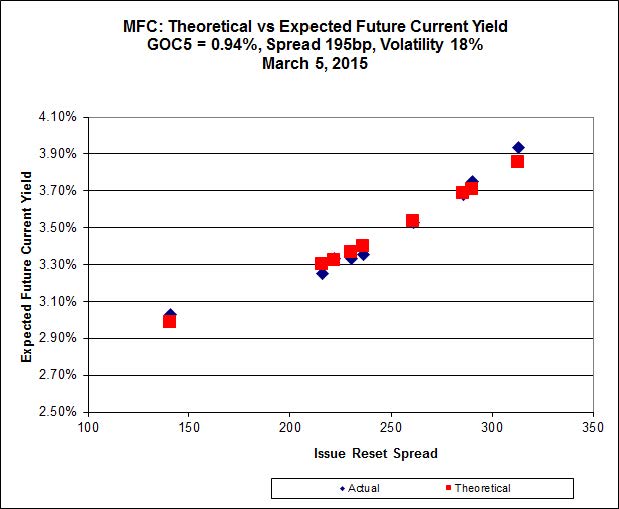
Another excellent fit, but the numbers are perplexing. Implied Volatility for MFC continues to be a conundrum, although it declined substantially today. It is still too high if we consider that NVCC rules will never apply to these issues; it is still too low if we consider them to be NVCC non-compliant issues (and therefore with Deemed Maturities in the call schedule).
Most expensive is MFC.PR.L, resetting at +216 on 2019-6-19, bid at 24.05 to be $0.44 rich, while MFC.PR.H, resetting at +313bp on 2017-3-19, is bid at 25.90 to be $0.51 cheap.
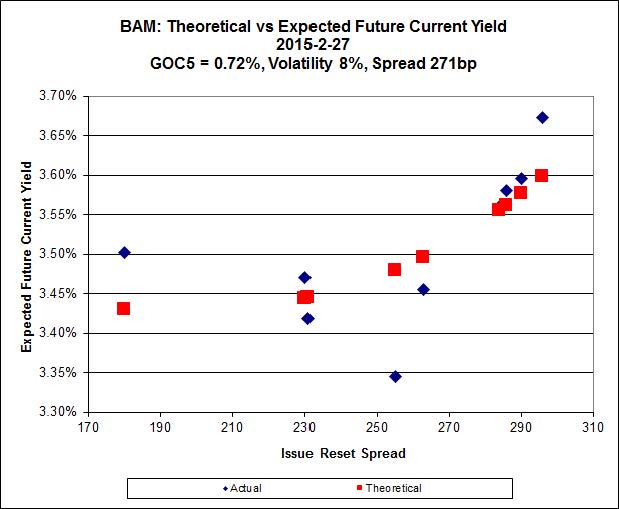
Click for Big
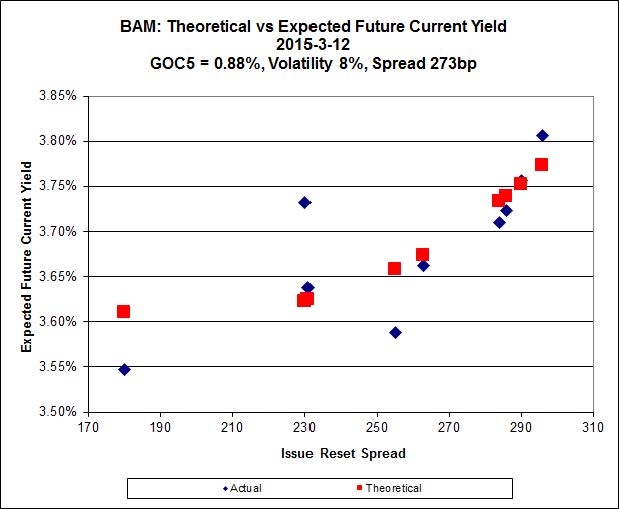
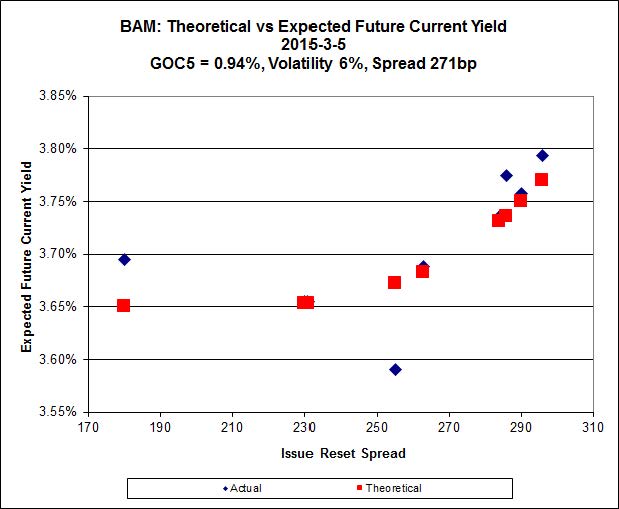
The fit on this series is actually quite reasonable – it’s the scale that makes it look so weird.
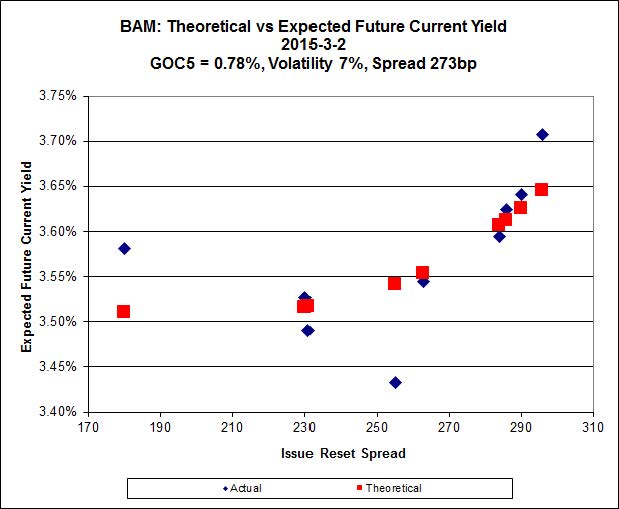
The cheapest issue relative to its peers is BAM.PR.R, resetting at +230bp on 2016-6-30, bid at 21.30 to be $0.65 cheap. BAM.PF.E, resetting at +255bp 2020-3-31 is bid at 23.90 and appears to be $0.46 rich.
Click for Big
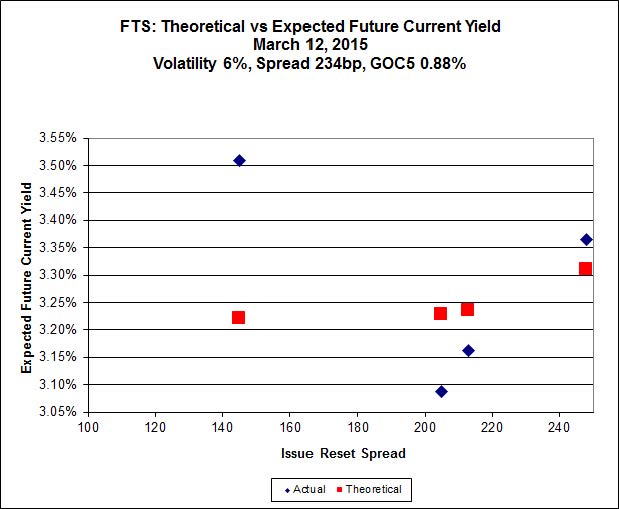
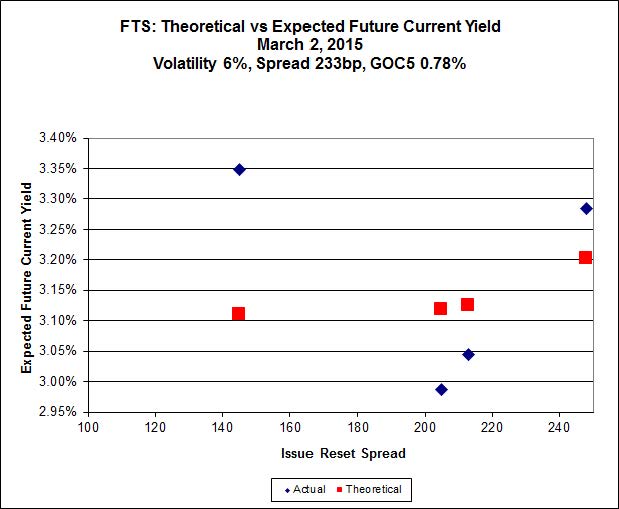
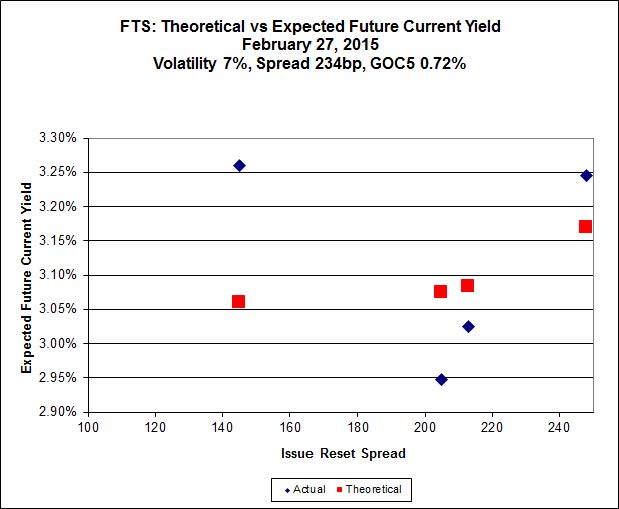
This is just weird because the middle is expensive and the ends are cheap but anyway … FTS.PR.H, with a spread of +145bp, and bid at 16.60, looks $1.49 cheap and resets 2015-6-1. FTS.PR.K, with a spread of +205bp and resetting 2019-3-1, is bid at 23.72 and is $1.03 rich.
Click for Big
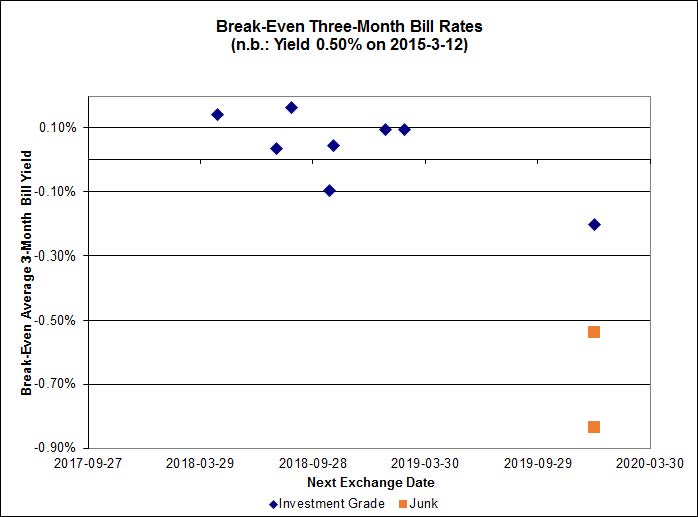
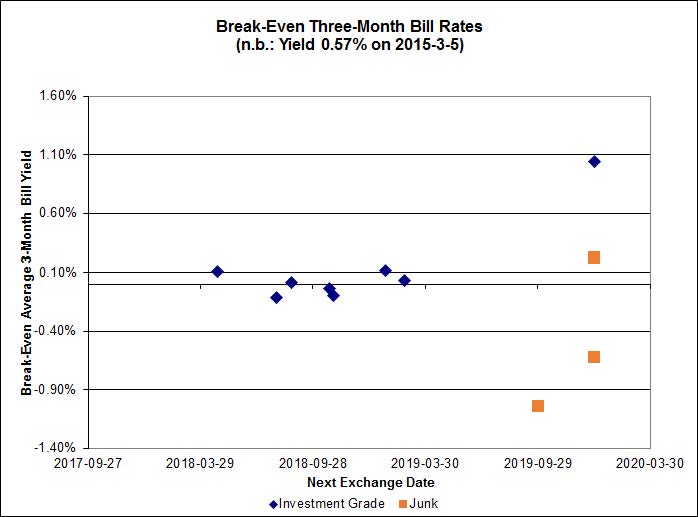
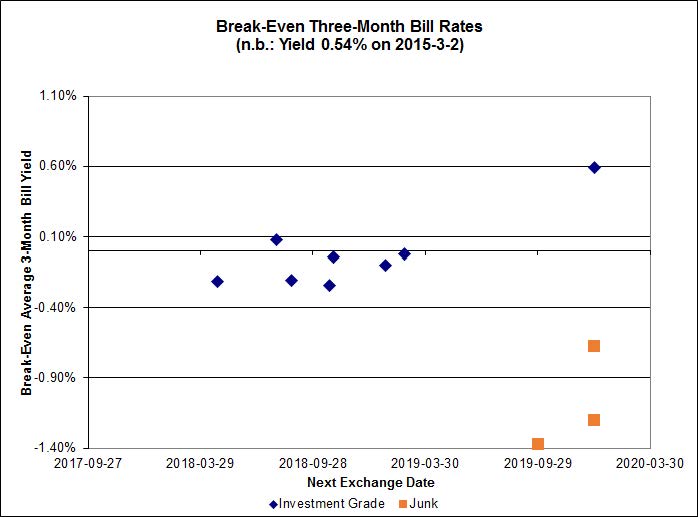
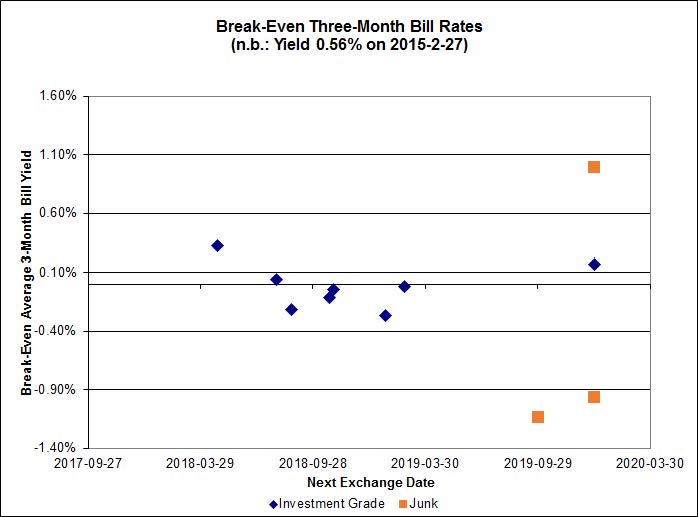
The cancellation of the previously announced deflationary environment had an immediate effect on the implied three month bill rate, with investment-grade pairs predicting an average over the next five years of between 0.00% and 0.10%
Click for Big
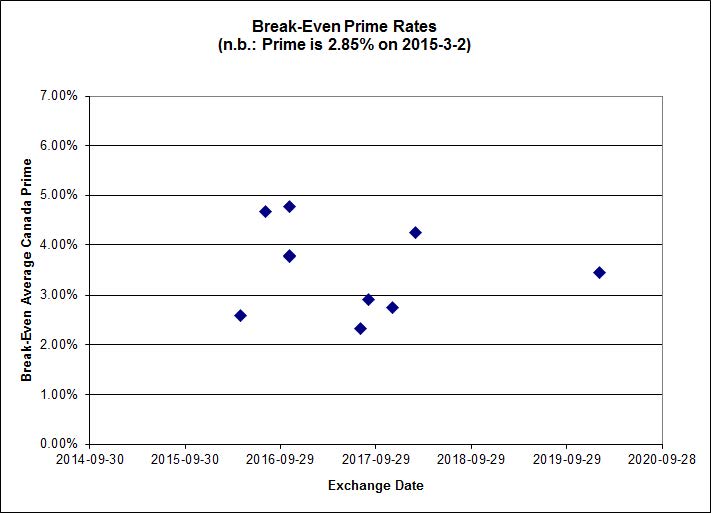
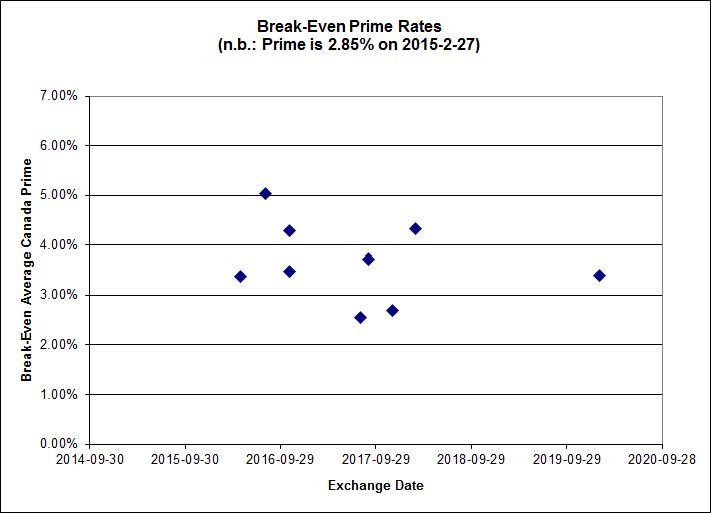
Shall we just say that this exhibits a high level of confidence in the continued rapacity of Canadian banks?
| HIMIPref™ Preferred Indices These values reflect the December 2008 revision of the HIMIPref™ Indices Values are provisional and are finalized monthly |
|||||||
| Index | Mean Current Yield (at bid) |
Median YTW |
Median Average Trading Value |
Median Mod Dur (YTW) |
Issues | Day’s Perf. | Index Value |
| Ratchet | 0.00 % | 0.00 % | 0 | 0.00 | 0 | -0.1487 % | 2,382.2 |
| FixedFloater | 0.00 % | 0.00 % | 0 | 0.00 | 0 | -0.1487 % | 4,165.2 |
| Floater | 3.18 % | 3.19 % | 70,741 | 19.28 | 3 | -0.1487 % | 2,532.5 |
| OpRet | 4.07 % | 1.29 % | 103,877 | 0.27 | 1 | -0.0794 % | 2,762.6 |
| SplitShare | 4.47 % | 4.43 % | 54,218 | 4.44 | 5 | -0.0637 % | 3,209.4 |
| Interest-Bearing | 0.00 % | 0.00 % | 0 | 0.00 | 0 | -0.0794 % | 2,526.1 |
| Perpetual-Premium | 5.30 % | 1.48 % | 57,411 | 0.08 | 25 | -0.1049 % | 2,517.9 |
| Perpetual-Discount | 5.02 % | 4.99 % | 154,888 | 15.44 | 9 | -0.4078 % | 2,784.4 |
| FixedReset | 4.40 % | 3.61 % | 242,117 | 16.54 | 84 | 0.2058 % | 2,427.9 |
| Deemed-Retractible | 4.91 % | 0.79 % | 108,651 | 0.13 | 37 | 0.0748 % | 2,654.6 |
| FloatingReset | 2.54 % | 2.97 % | 83,226 | 6.32 | 8 | -0.0962 % | 2,333.9 |
| Performance Highlights | |||
| Issue | Index | Change | Notes |
| FTS.PR.J | Perpetual-Premium | -1.61 % | YTW SCENARIO Maturity Type : Limit Maturity Maturity Date : 2045-03-12 Maturity Price : 24.08 Evaluated at bid price : 24.50 Bid-YTW : 4.86 % |
| BAM.PR.N | Perpetual-Discount | -1.36 % | YTW SCENARIO Maturity Type : Limit Maturity Maturity Date : 2045-03-12 Maturity Price : 22.00 Evaluated at bid price : 22.44 Bid-YTW : 5.28 % |
| BAM.PF.C | Perpetual-Discount | -1.29 % | YTW SCENARIO Maturity Type : Limit Maturity Maturity Date : 2045-03-12 Maturity Price : 22.50 Evaluated at bid price : 22.90 Bid-YTW : 5.29 % |
| BAM.PF.D | Perpetual-Discount | -1.19 % | YTW SCENARIO Maturity Type : Limit Maturity Maturity Date : 2045-03-12 Maturity Price : 22.95 Evaluated at bid price : 23.25 Bid-YTW : 5.27 % |
| MFC.PR.B | Deemed-Retractible | -1.07 % | YTW SCENARIO Maturity Type : Hard Maturity Maturity Date : 2025-01-31 Maturity Price : 25.00 Evaluated at bid price : 24.02 Bid-YTW : 5.18 % |
| MFC.PR.M | FixedReset | 1.02 % | YTW SCENARIO Maturity Type : Hard Maturity Maturity Date : 2025-01-31 Maturity Price : 25.00 Evaluated at bid price : 24.73 Bid-YTW : 3.74 % |
| SLF.PR.I | FixedReset | 1.04 % | YTW SCENARIO Maturity Type : Call Maturity Date : 2016-12-31 Maturity Price : 25.00 Evaluated at bid price : 25.34 Bid-YTW : 3.35 % |
| BAM.PF.G | FixedReset | 1.05 % | YTW SCENARIO Maturity Type : Limit Maturity Maturity Date : 2045-03-12 Maturity Price : 23.17 Evaluated at bid price : 25.07 Bid-YTW : 3.82 % |
| SLF.PR.H | FixedReset | 1.12 % | YTW SCENARIO Maturity Type : Hard Maturity Maturity Date : 2025-01-31 Maturity Price : 25.00 Evaluated at bid price : 22.60 Bid-YTW : 4.43 % |
| TRP.PR.C | FixedReset | 1.23 % | YTW SCENARIO Maturity Type : Limit Maturity Maturity Date : 2045-03-12 Maturity Price : 17.26 Evaluated at bid price : 17.26 Bid-YTW : 3.74 % |
| IAG.PR.G | FixedReset | 1.35 % | YTW SCENARIO Maturity Type : Call Maturity Date : 2017-06-30 Maturity Price : 25.00 Evaluated at bid price : 26.25 Bid-YTW : 1.97 % |
| TRP.PR.B | FixedReset | 1.40 % | YTW SCENARIO Maturity Type : Limit Maturity Maturity Date : 2045-03-12 Maturity Price : 15.21 Evaluated at bid price : 15.21 Bid-YTW : 3.65 % |
| ENB.PR.Y | FixedReset | 1.42 % | YTW SCENARIO Maturity Type : Limit Maturity Maturity Date : 2045-03-12 Maturity Price : 20.04 Evaluated at bid price : 20.04 Bid-YTW : 4.36 % |
| CIU.PR.C | FixedReset | 2.80 % | YTW SCENARIO Maturity Type : Limit Maturity Maturity Date : 2045-03-12 Maturity Price : 16.90 Evaluated at bid price : 16.90 Bid-YTW : 3.53 % |
| Volume Highlights | |||
| Issue | Index | Shares Traded |
Notes |
| HSE.PR.E | FixedReset | 609,364 | New issue settled today. YTW SCENARIO Maturity Type : Limit Maturity Maturity Date : 2045-03-12 Maturity Price : 23.14 Evaluated at bid price : 24.95 Bid-YTW : 4.42 % |
| BIP.PR.A | FixedReset | 388,980 | New issue settled today. YTW SCENARIO Maturity Type : Limit Maturity Maturity Date : 2045-03-12 Maturity Price : 22.97 Evaluated at bid price : 24.51 Bid-YTW : 4.51 % |
| CM.PR.Q | FixedReset | 236,325 | Recent new issue. YTW SCENARIO Maturity Type : Limit Maturity Maturity Date : 2045-03-12 Maturity Price : 23.05 Evaluated at bid price : 24.75 Bid-YTW : 3.62 % |
| TRP.PR.G | FixedReset | 111,431 | Recent new issue. YTW SCENARIO Maturity Type : Limit Maturity Maturity Date : 2045-03-12 Maturity Price : 23.05 Evaluated at bid price : 24.80 Bid-YTW : 3.79 % |
| TD.PF.D | FixedReset | 57,850 | Recent new issue. YTW SCENARIO Maturity Type : Limit Maturity Maturity Date : 2045-03-12 Maturity Price : 23.12 Evaluated at bid price : 24.95 Bid-YTW : 3.58 % |
| GWO.PR.R | Deemed-Retractible | 51,273 | RBC crossed 33,200 at 25.30. YTW SCENARIO Maturity Type : Hard Maturity Maturity Date : 2025-01-31 Maturity Price : 25.00 Evaluated at bid price : 25.30 Bid-YTW : 4.64 % |
| There were 31 other index-included issues trading in excess of 10,000 shares. | |||
| Wide Spread Highlights | ||
| Issue | Index | Quote Data and Yield Notes |
| GWO.PR.G | Deemed-Retractible | Quote: 25.35 – 25.88 Spot Rate : 0.5300 Average : 0.3230 YTW SCENARIO |
| FTS.PR.J | Perpetual-Premium | Quote: 24.50 – 25.09 Spot Rate : 0.5900 Average : 0.3994 YTW SCENARIO |
| MFC.PR.B | Deemed-Retractible | Quote: 24.02 – 24.50 Spot Rate : 0.4800 Average : 0.3052 YTW SCENARIO |
| MFC.PR.H | FixedReset | Quote: 25.90 – 26.25 Spot Rate : 0.3500 Average : 0.2422 YTW SCENARIO |
| FTS.PR.G | FixedReset | Quote: 23.80 – 24.14 Spot Rate : 0.3400 Average : 0.2379 YTW SCENARIO |
| BAM.PF.F | FixedReset | Quote: 25.11 – 25.42 Spot Rate : 0.3100 Average : 0.2080 YTW SCENARIO |


