Today’s big news was the FOMC release:
Information received since the Federal Open Market Committee met in October suggests that economic activity is expanding at a moderate pace. Labor market conditions improved further, with solid job gains and a lower unemployment rate. On balance, a range of labor market indicators suggests that underutilization of labor resources continues to diminish. Household spending is rising moderately and business fixed investment is advancing, while the recovery in the housing sector remains slow. Inflation has continued to run below the Committee’s longer-run objective, partly reflecting declines in energy prices. Market-based measures of inflation compensation have declined somewhat further; survey-based measures of longer-term inflation expectations have remained stable.
…
To support continued progress toward maximum employment and price stability, the Committee today reaffirmed its view that the current 0 to 1/4 percent target range for the federal funds rate remains appropriate. In determining how long to maintain this target range, the Committee will assess progress–both realized and expected–toward its objectives of maximum employment and 2 percent inflation.
…
However, if incoming information indicates faster progress toward the Committee’s employment and inflation objectives than the Committee now expects, then increases in the target range for the federal funds rate are likely to occur sooner than currently anticipated. Conversely, if progress proves slower than expected, then increases in the target range are likely to occur later than currently anticipated.
As always, the votes against and rationales thereof are illuminating:
Voting against the action were Richard W. Fisher, who believed that, while the Committee should be patient in beginning to normalize monetary policy, improvement in the U.S. economic performance since October has moved forward, further than the majority of the Committee envisions, the date when it will likely be appropriate to increase the federal funds rate; Narayana Kocherlakota, who believed that the Committee’s decision, in the context of ongoing low inflation and falling market-based measures of longer-term inflation expectations, created undue downside risk to the credibility of the 2 percent inflation target; and Charles I. Plosser, who believed that the statement should not stress the importance of the passage of time as a key element of its forward guidance and, given the improvement in economic conditions, should not emphasize the consistency of the current forward guidance with previous statements.
We don’t get this kind of detail in Canada because none of us are actual adults and might burst into tears if there was any conflict of opinion.
Yellen elaborated:
Yellen told reporters following a two-day meeting that the Fed is likely to hold rates near zero at least through the first quarter. She also laid out the economic parameters that would need to be met for liftoff to begin later in the year and said that rates probably would be raised gradually thereafter. They may not return to more normal levels until 2017, she added.
…
The dollar and yields on Treasury securities rose in response, as investors in those markets processed the likelihood of rate increases by the Fed. The greenback gained against most currencies, with the Bloomberg Dollar Spot Index increasing to almost a five-year high. The yield on 10-year Treasuries rose eight basis points to 2.14 percent as of 5 p.m. in New York, according to Bloomberg Trader data.
Certainly, US inflation looks tame:
Consumer prices rose 1.3 percent over the past year, the smallest gain since February and down from a 1.7 percent annual advance the prior month, according to the Labor Department.
…
Energy costs decreased 3.8 percent from a month earlier, led by a 6.6 percent plunge in gasoline that was the biggest drop since December 2008. Food prices rose 0.2 percent.
Excluding volatile food and fuel, the so-called core measure rose 0.1 percent in November, bringing the advance over the past year down to 1.7 percent from 1.8 percent in October. The gain matched the median forecast of economists surveyed by Bloomberg and followed a 0.2 percent increase the prior month.
Rising rents, medical care and airline fares were almost completely offset by the biggest drop in clothing costs in 16 years and the largest fall in prices for used cars and trucks since September 2012.
Speaking of inflation, how about that US two-year break-even inflation rate, eh?:
A Treasury market gauge measuring the outlook for inflation turned negative for the first time in five years as oil costs and consumer prices tumble.
The difference between yields on two-year notes and same-maturity Treasury Inflation Protected Securities, which measures trader expectations for consumer prices over the life of the debt, dropped to minus three basis points yesterday. Treasury long-term yields are falling as inflation slows, while shorter maturities lagged behind as the Federal Reserve prepares to raise interest rates, flattening the so-called yield curve.
Here’s a badge of honour!
What do Highland Capital Management, Fortress Investment Group LLC (FIG) and Cerberus Capital Management have in common? The firms, which manage some $110 billion among them, are on a list that says they can never invest in a $155 million loan that’s trading in U.S. markets.
RBS Holding Co., the owner of direct marketer Quadriga Art, banned the three firms and seven others last year from buying parts of the loan, according to two people with knowledge of the matter who asked not to be named because the decision was private. They were deemed, the people said, to be too demanding in debt restructurings, a fate that executives at RBS — which has no relationship to the Scottish bank — considered as Quadriga’s business faltered.
…
The practice poses risks to a market whose size has quadrupled from about $200 billion over the last decade as plunging interest rates fueled investor demand for securities that offer extra yield. Blacklisting reduces the number of potential buyers, which in turn makes the loans difficult to trade, and can exclude the savvier investors who are better able to fight for creditor rights in a default.
…
It took 20 days on average to complete a loan trade in the three months ending in June, according to data compiled by the New York-based Loan Syndications & Trading Association. That’s almost seven times as long as the three-day average in the corporate bond market.
…
Data gathered by Xtract Research show that 77 percent of all loan deals in the third quarter included provisions giving borrowers the ability to block individual lenders, up from 51 percent at the end of last year.
NexGen Financial Corporation has announced:
that at today’s special meeting its shareholders overwhelmingly approved the previously announced plan of arrangement (the “Arrangement”) between a wholly-owned subsidiary of Natixis Global Asset Management, L.P. and NexGen. The Arrangement was approved by 99.97% of the votes cast by NexGen’s shareholders and 99.96% of the votes cast by NexGen’s shareholders who are not receiving a collateral benefit in connection with the Arrangement. A total of 84.85% of the outstanding common shares of NexGen were voted at the meeting. Now that the requisite shareholder approvals have been obtained, a final order of the Ontario Superior Court of Justice approving the Arrangement will be sought on December 18, 2014. If the final order is obtained, management anticipates that the Arrangement will be completed on or about December 22, 2014, subject to receiving all necessary regulatory approvals.
NexGen was founded in 2005 and has about $885-million under management; Natixis is a conglomerator with over twenty firms in its stable and $894-billion under management.
Sun Life Financial, proud issuer of SLF.PR.A, SLF.PR.B, SLF.PR.C, SLF.PR.D, SLF.PR.E, SLF.PR.G, SLF.PR.H and SLF.PR.I, was confirmed at Pfd-2(high) by DBRS:
Compared to its peers, the Company has a high proportion of BBB and lower-rated bonds to total bonds, at 33.2%. With the Company’s sizable business in the Philippines, it has invested local premium in Philippine government bonds to avoid currency risks.
Return on equity and EBIT fixed-charge coverage ratios are expected to improve with the Company’s efforts to improve profitability toward meeting its 2015 targets. This focus on profitability should have lasting benefits. The five-year historical averages are below the rating level, but improvements are expected.
Financial leverage has declined to near 24% with improved retained earnings and with the Company using the proceeds of the sale of the U.S. business to repay maturing debt. This improved leverage is noted by DBRS, as the Company has had financial leverage ratios above 30%.
Great-West Lifeco, proud issuer of GWO.PR.F, GWO.PR.G, GWO.PR.H, GWO.PR.I, GWO.PR.L, GWO.PR.M, GWO.PR.N, GWO.PR.P, GWO.PR.Q, GWO.PR.R and GWO.PR.S, was confirmed at Pfd-1(low) by DBRS:
With the employed leverage combined with stable profits, the Company has been able to produce an above-peer return on equity in the mid-teens for several years running. As the Company is the largest insurer in Canada, top-line growth will be limited largely to total market growth. Growth by acquisition within Canada is limited, given the dominance of the big three insurers. Achieving a full turnaround with the Putnam investment subsidiary has proven elusive, but recently the funds have achieved high-ranking performance statistics, which should allow a shift toward better results.
Financial leverage at September 30, 2014, is 30.1%, which is better than its prior highs near 34%. As compared with recent leverage reduction achievements of its peers, the Company has been slow in reducing leverage toward its long-term target of 25%. The current leverage ratio is higher than desirable for the rating level.
Industrial Alliance Insurance and Financial Services Inc., proud issuer of IAG.PR.A, IAG.PR.E (soon to be redeemed), IAG.PR.F and IAG.PR.G, was confirmed at Pfd-2(high) by DBRS:
Despite the largely unfavourable market environment, the Company’s return on equity has generally been in the 12% to 13% range for most of the last five years.
The Company has a more aggressive risk appetite compared with other industry players, as demonstrated by its higher tolerance for interest rate and equity market sensitivity and willingness to pursue niche opportunities in the property and casualty space. The Company has rapidly reduced its financial leverage ratio to 25.9% as at September 30, 2014, from a ratio near 36% in 2012 by raising equity and paying down debt. EBIT fixed- charge coverage ratios have been improving and are now in the 5 times coverage range. Both leverage and coverage ratios now sit within or are near the range for an A-rated company.
The minimum continuing capital and surplus requirement at September 30, 2014, is 215%, which is satisfactory for the rating, but considering the sensitivity to interest rates and equities, the Company needs to maintain the ratio in the higher levels.
It was a mixed day for the Canadian preferred share market, with PerpetualDiscounts gaining 1bp, FixedResets down 10bp and DeemedRetractibles off 5bp. There is yet another very lengthy list of performance highlights, with both winners and losers dominated by FixedResets. Volume was average, but the highlights are notable for the presence of two floaters, which usually trade by appointment only and performed poorly – probably due to a dovish interpretation of the FOMC release.
PerpetualDiscounts now yield 5.14%, equivalent to 6.68% interest at the standard equivalency factor of 1.3x. Long corporates now yield about 4.0%, so the pre-tax interest-equivalent spread (in this context, the “Seniority Spread”) is now about 270bp, a significant widening from the 255bp reported December 10.
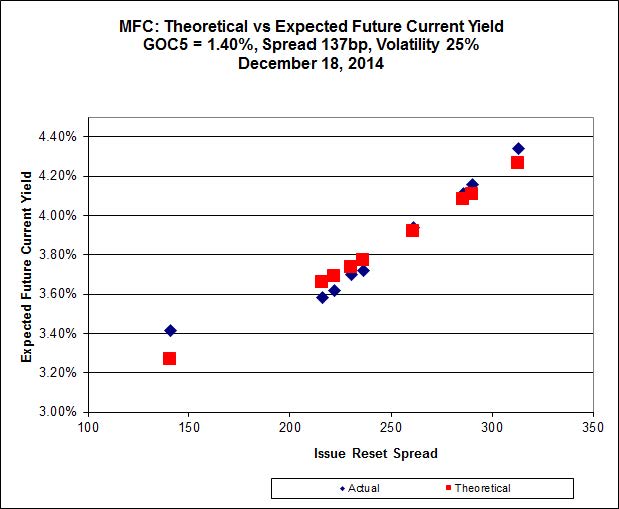
For as long as the FixedReset market is so violently unsettled, I’ll keep publishing updates of the more interesting and meaningful series of FixedResets’ Implied Volatilities. This doesn’t include Enbridge because although Enbridge has a large number of issues outstanding, all of which are quite liquid, the range of Issue Reset Spreads is too small for decent conclusions. The low is 212bp (ENB.PR.H; second-lowest is ENB.PR.D at 237bp) and the high is a mere 268 for ENB.PF.G.
Remember that all rich /cheap assessments are:
- based on Implied Volatility Theory only
- are relative only to other FixedResets from the same issuer
- assume constant GOC-5 yield
- assume constant Implied Volatility
- assume constant spread
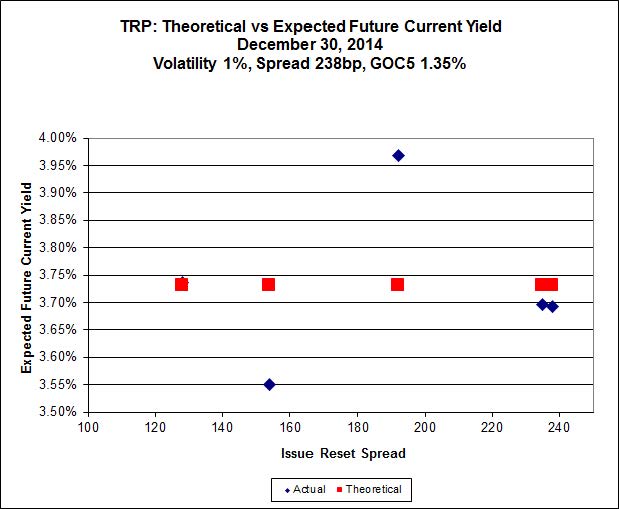
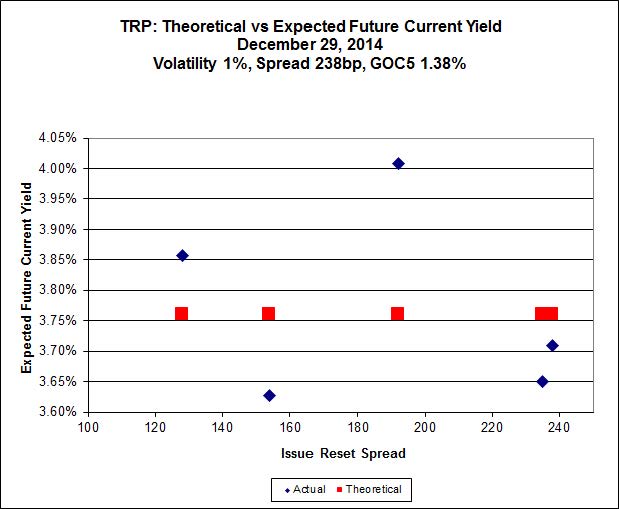
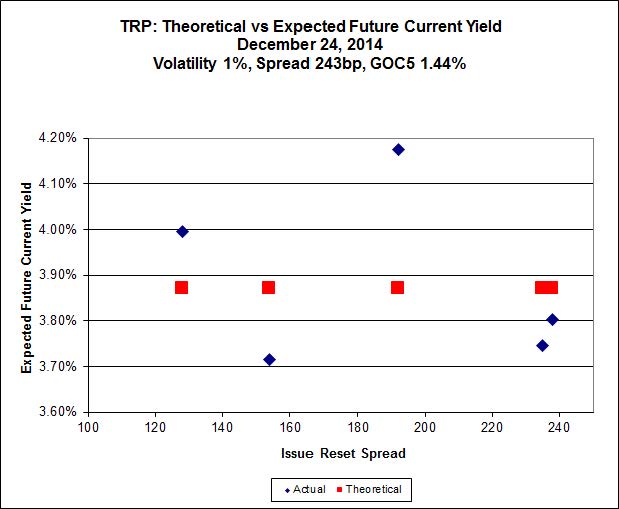
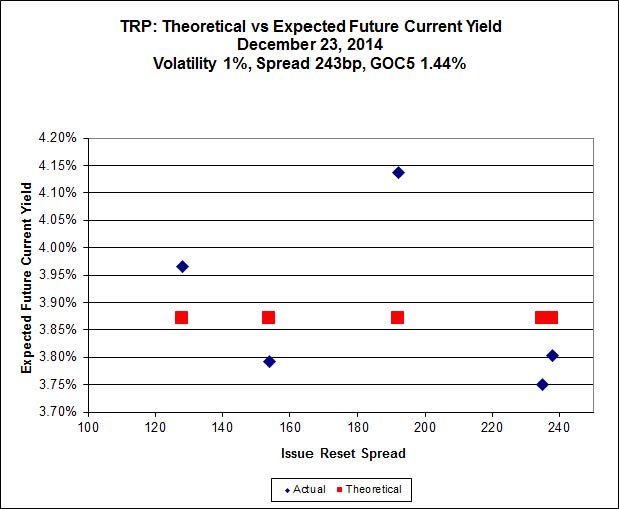
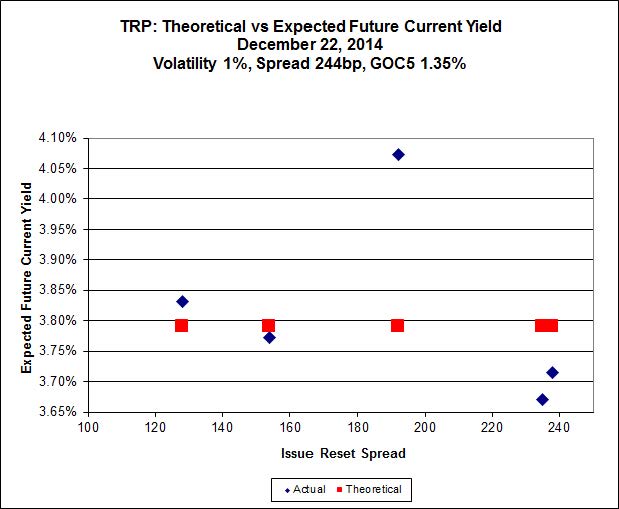
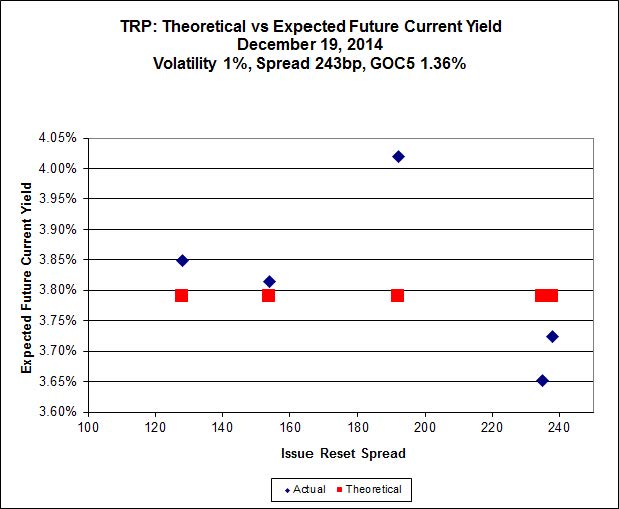
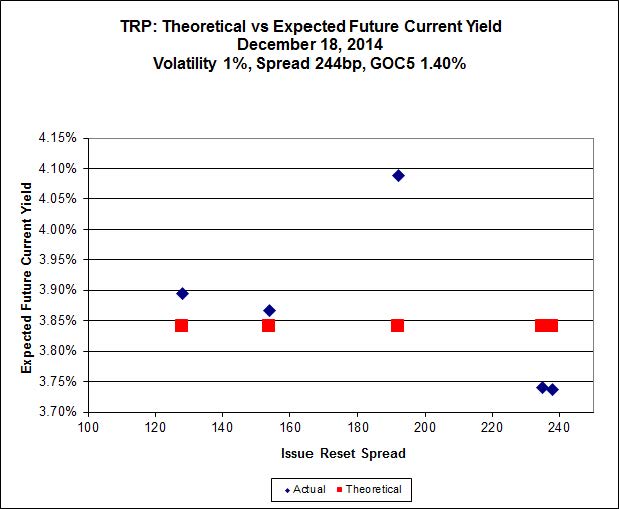
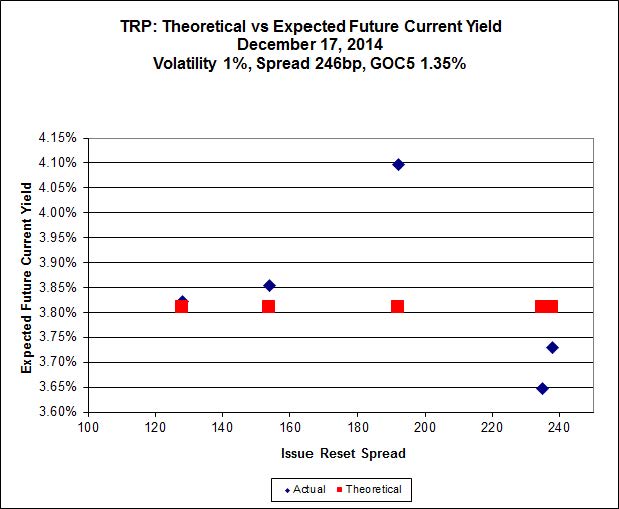
Here’s TRP:
 Click for Big
So according to this, TRP.PR.A, bid at 19.95, is $1.51 cheap, but it has already reset (at +192). TRP.PR.D, bid at 25.00 and resetting at +238bp on 2019-4-30 is $0.52 rich and TRP.PR.E, bid at 25.36 and resetting at +235bp on 2019-10-30, is $1.08 rich.
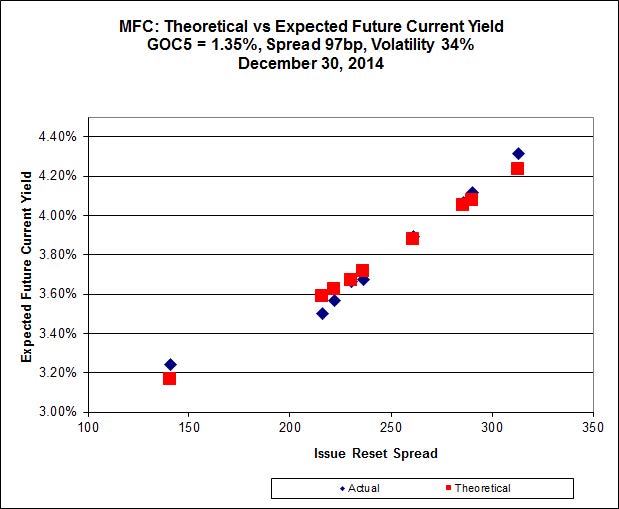
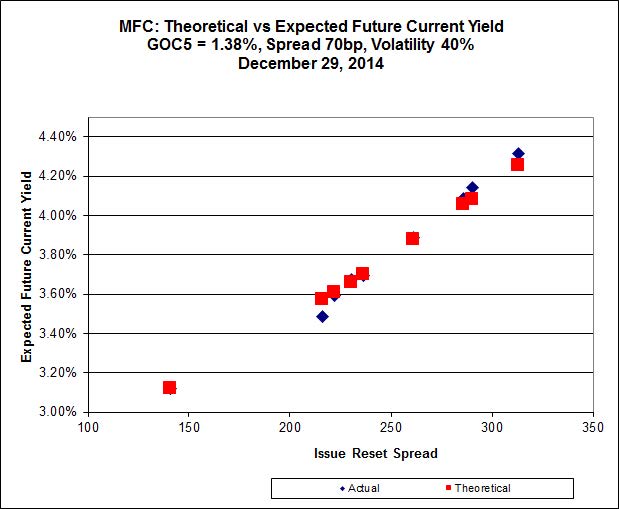
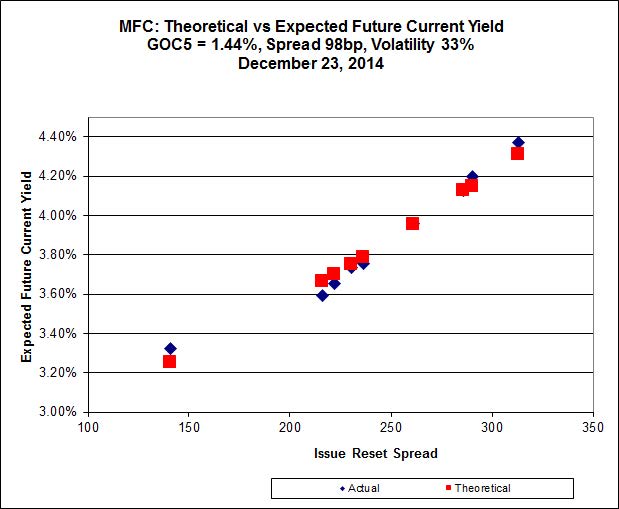
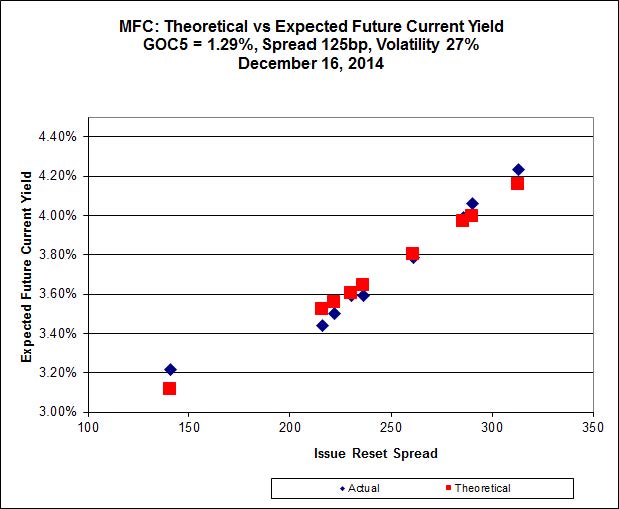
 Click for Big
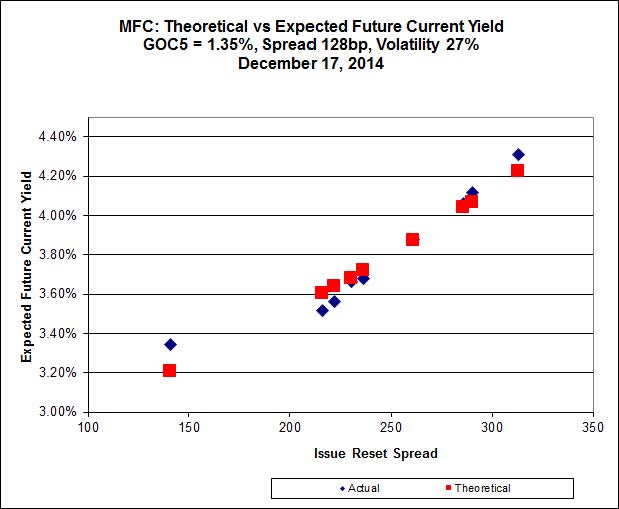
It looks like MFC.PR.F, resetting at 141bp on 2016-06-19 is in another world and distorting results again. It’s the only deep-discount issue, bid at 20.65 – everything else is above or near par.
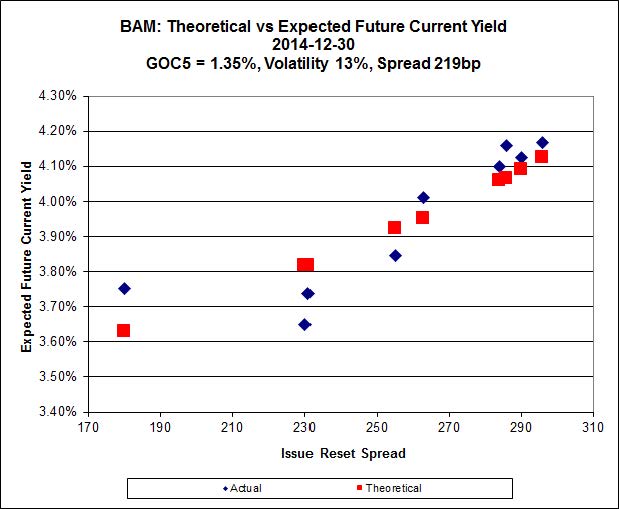
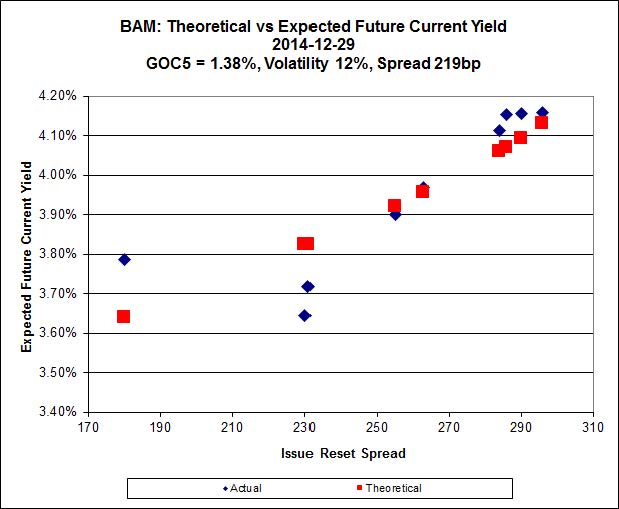
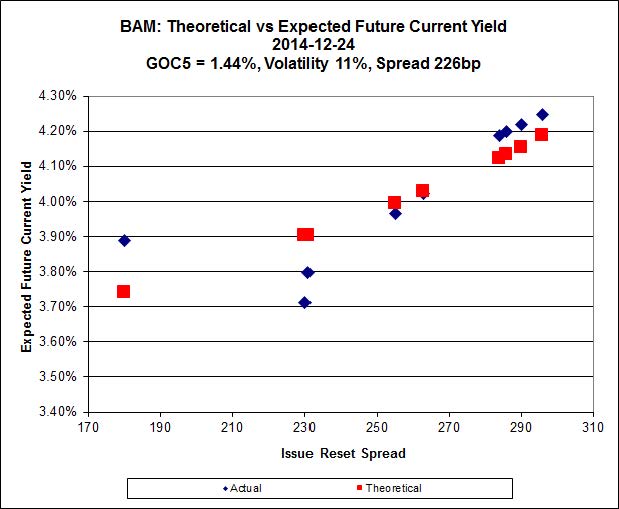
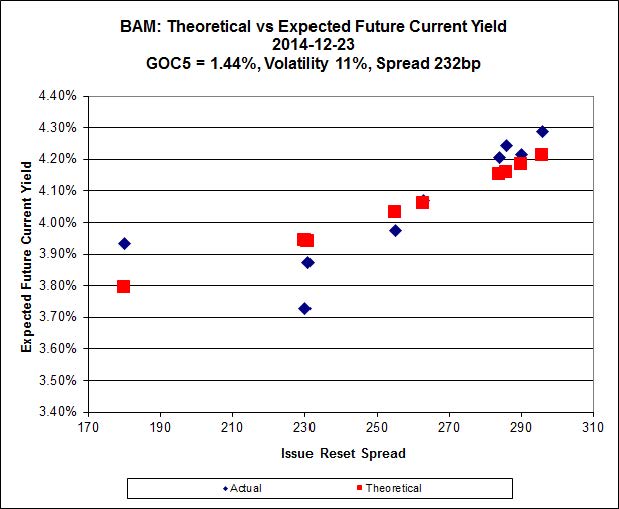
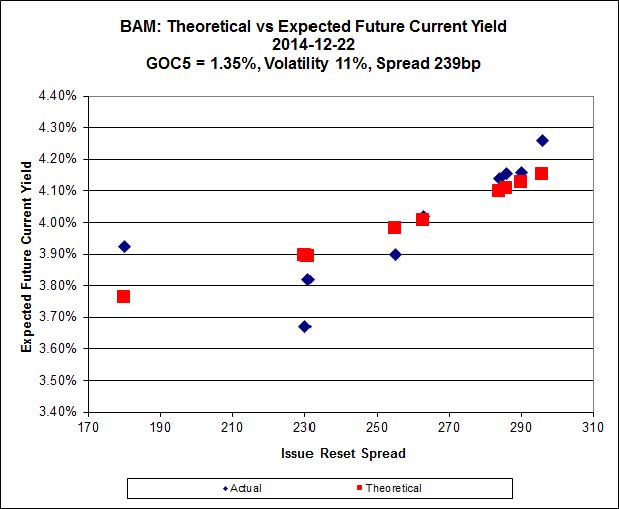
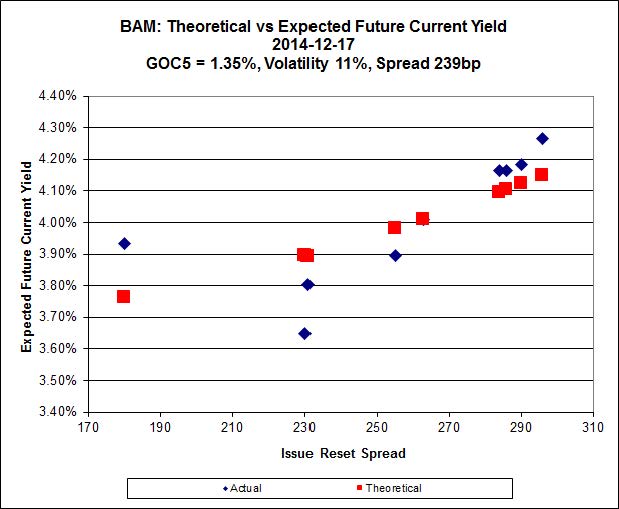
 Click for Big
There continues to be extraordinary cheapness in the lowest-spread issue, BAM.PR.X, resetting at +180bp on 2017-6-30, is bid at 20.02 and appears to be $0.91 cheap, while BAM.PR.R, resetting at +230bp 2016-6-30 is bid at 25.00 and appears to be $1.57 rich.
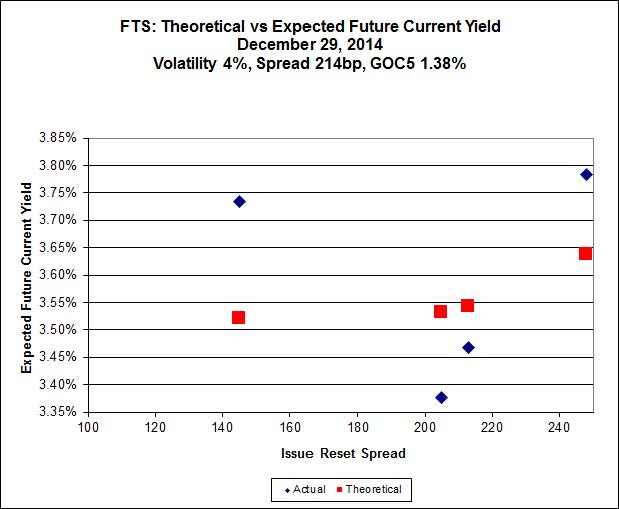
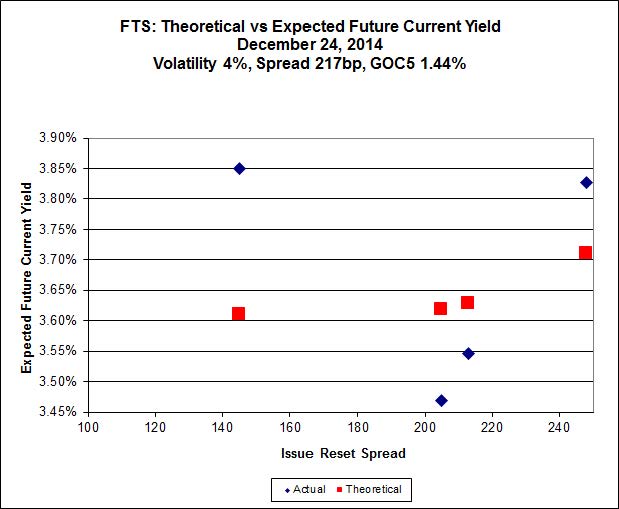
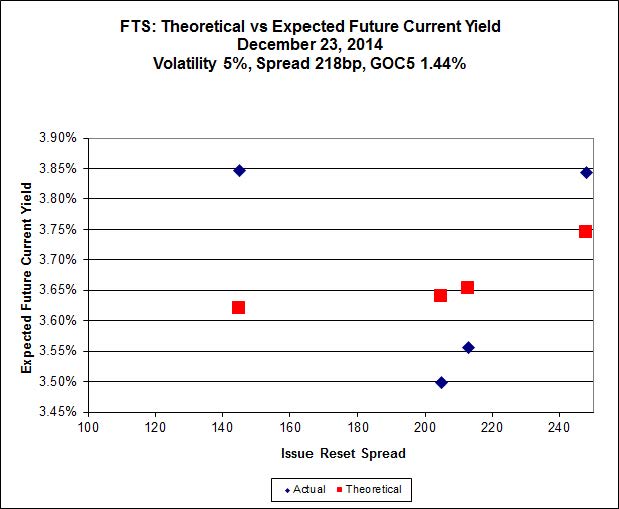
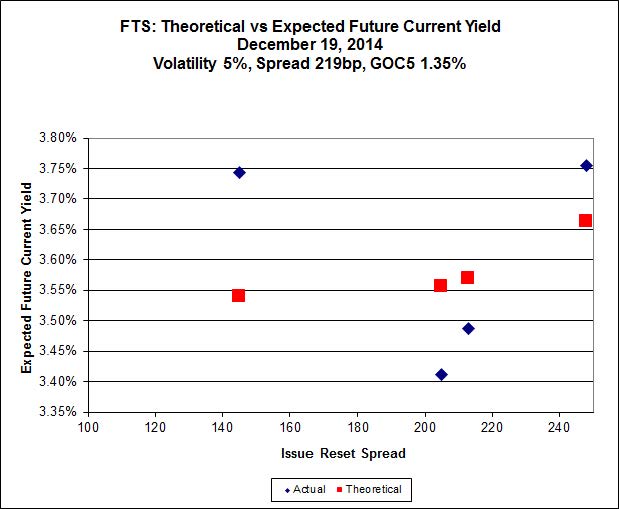
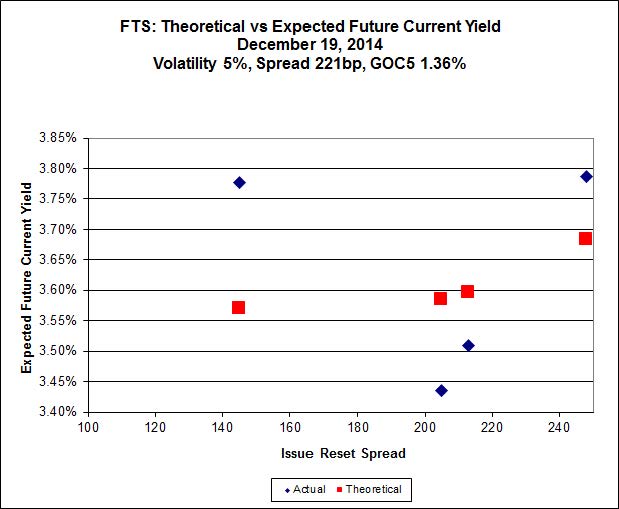
 Click for Big
This is just weird because the middle is expensive and the ends are cheap but anyway … FTS.PR.H, with a spread of +145bp, and bid at 18.10, looks $1.45 cheap and resets 2015-6-1. FTS.PR.K, with a spread of +205bp, and bid at 24.87, looks $1.21 expensive and resets 2019-3-1
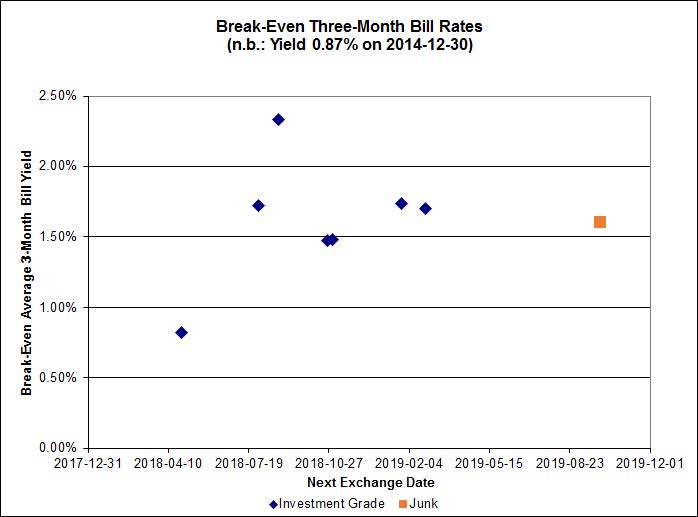
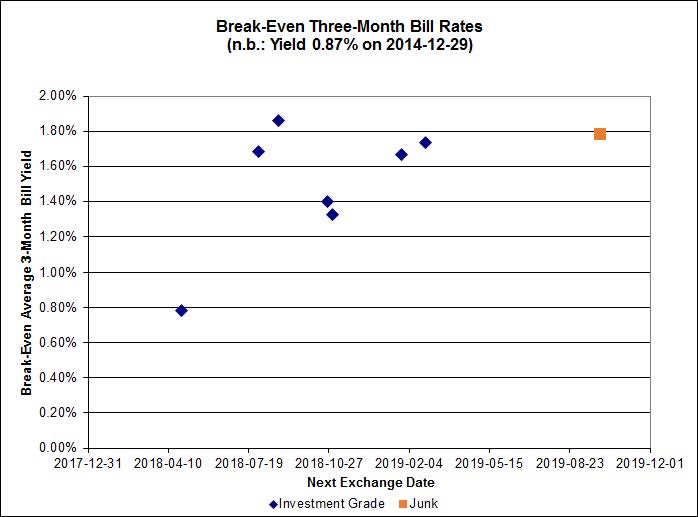
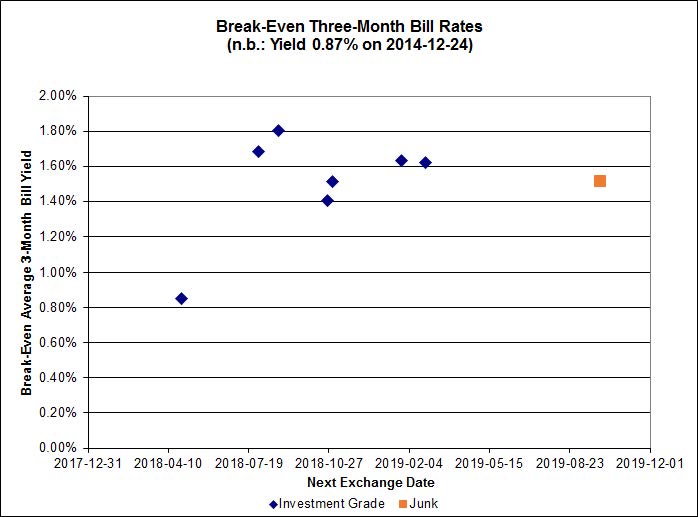
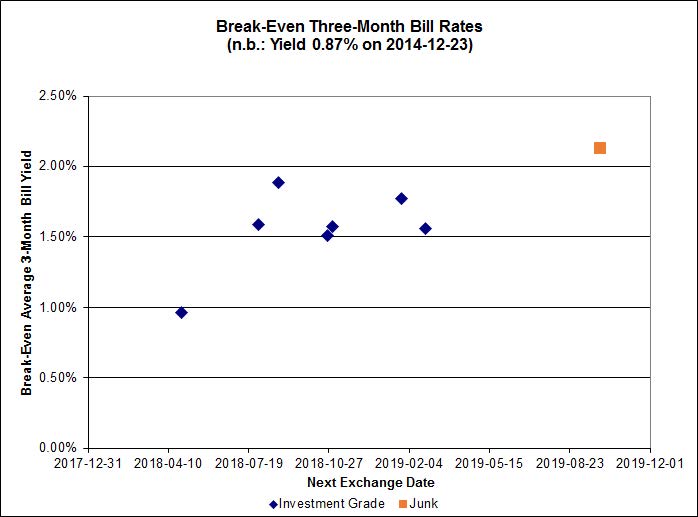
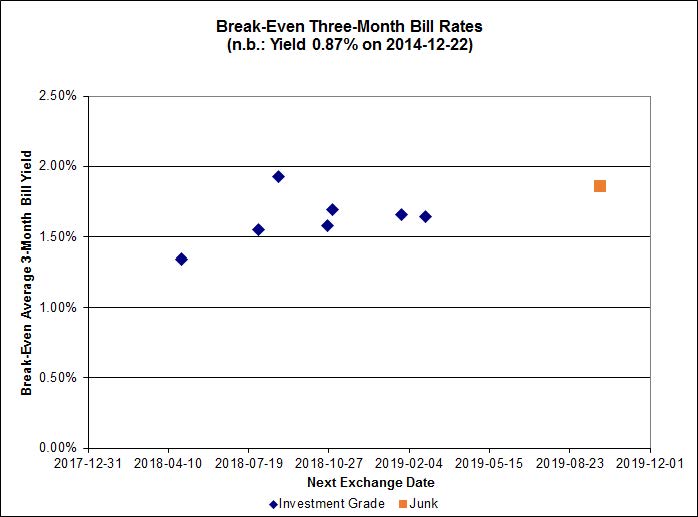
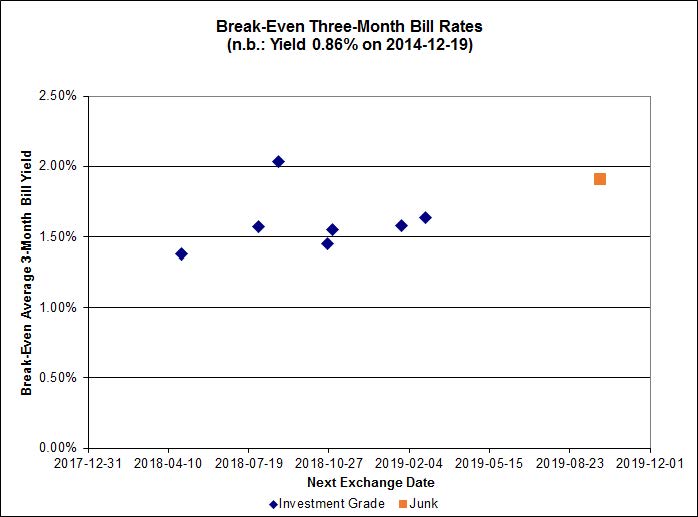
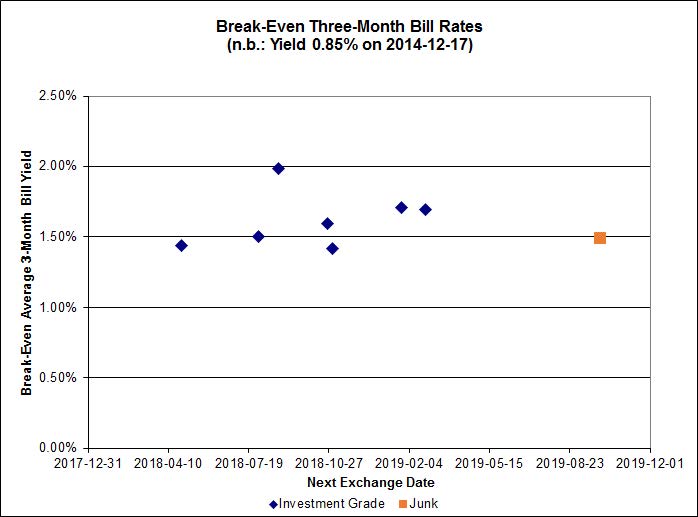
 Click for Big
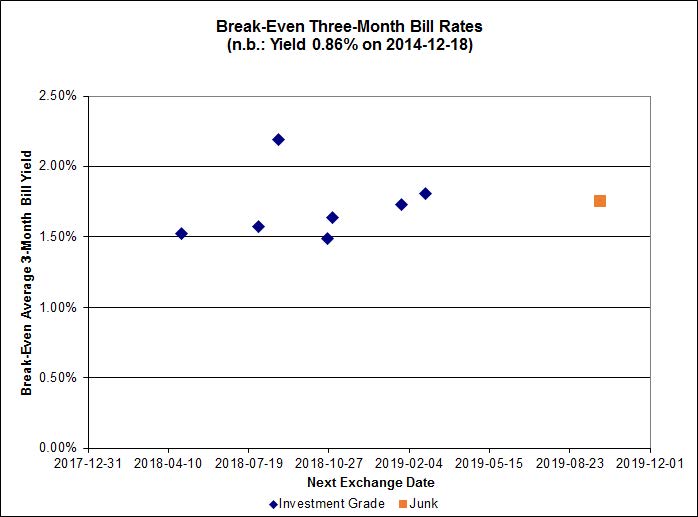
Given all today’s speculation on policy rates – and the performance of Floaters – I thought I’d have another look at the break-even bill rates for the FixedReset/FloatingReset Strong Pairs.
The average break-even rate has declined from 1.80%-2.00% at the time recent conversion decisions were made to a current range of 1.50%-1.70%. This decline means that the estimated profit on TRP.PR.A conversion has declined from $0.48 to a mere $0.16 (at the lower end of the range).
HIMIPref™ Preferred Indices
These values reflect the December 2008 revision of the HIMIPref™ Indices
Values are provisional and are finalized monthly |
| Index |
Mean
Current
Yield
(at bid) |
Median
YTW |
Median
Average
Trading
Value |
Median
Mod Dur
(YTW) |
Issues |
Day’s Perf. |
Index Value |
| Ratchet |
0.00 % |
0.00 % |
0 |
0.00 |
0 |
-1.4405 % |
2,469.5 |
| FixedFloater |
0.00 % |
0.00 % |
0 |
0.00 |
0 |
-1.4405 % |
3,909.8 |
| Floater |
3.07 % |
3.17 % |
64,422 |
19.30 |
4 |
-1.4405 % |
2,625.3 |
| OpRet |
4.41 % |
-2.62 % |
27,577 |
0.08 |
2 |
-0.0588 % |
2,747.2 |
| SplitShare |
4.29 % |
4.06 % |
41,675 |
3.71 |
5 |
0.4192 % |
3,185.8 |
| Interest-Bearing |
0.00 % |
0.00 % |
0 |
0.00 |
0 |
-0.0588 % |
2,512.0 |
| Perpetual-Premium |
5.45 % |
1.35 % |
74,676 |
0.08 |
20 |
-0.0843 % |
2,471.7 |
| Perpetual-Discount |
5.22 % |
5.14 % |
110,760 |
15.19 |
15 |
0.0144 % |
2,634.5 |
| FixedReset |
4.28 % |
3.63 % |
234,962 |
16.57 |
77 |
-0.0978 % |
2,509.0 |
| Deemed-Retractible |
5.01 % |
2.66 % |
98,405 |
0.60 |
40 |
-0.0479 % |
2,597.3 |
| FloatingReset |
2.56 % |
2.13 % |
63,301 |
3.51 |
5 |
0.0079 % |
2,531.6 |
| Performance Highlights |
| Issue |
Index |
Change |
Notes |
| IFC.PR.A |
FixedReset |
-2.65 % |
YTW SCENARIO
Maturity Type : Hard Maturity
Maturity Date : 2025-01-31
Maturity Price : 25.00
Evaluated at bid price : 22.01
Bid-YTW : 4.93 % |
| GWO.PR.N |
FixedReset |
-2.20 % |
YTW SCENARIO
Maturity Type : Hard Maturity
Maturity Date : 2025-01-31
Maturity Price : 25.00
Evaluated at bid price : 19.57
Bid-YTW : 5.55 % |
| BAM.PR.K |
Floater |
-2.08 % |
YTW SCENARIO
Maturity Type : Limit Maturity
Maturity Date : 2044-12-17
Maturity Price : 16.45
Evaluated at bid price : 16.45
Bid-YTW : 3.18 % |
| MFC.PR.B |
Deemed-Retractible |
-1.94 % |
YTW SCENARIO
Maturity Type : Hard Maturity
Maturity Date : 2025-01-31
Maturity Price : 25.00
Evaluated at bid price : 23.24
Bid-YTW : 5.60 % |
| IGM.PR.B |
Perpetual-Premium |
-1.76 % |
YTW SCENARIO
Maturity Type : Call
Maturity Date : 2018-12-31
Maturity Price : 25.00
Evaluated at bid price : 25.72
Bid-YTW : 5.34 % |
| BAM.PR.C |
Floater |
-1.67 % |
YTW SCENARIO
Maturity Type : Limit Maturity
Maturity Date : 2044-12-17
Maturity Price : 16.45
Evaluated at bid price : 16.45
Bid-YTW : 3.18 % |
| MFC.PR.F |
FixedReset |
-1.67 % |
YTW SCENARIO
Maturity Type : Hard Maturity
Maturity Date : 2025-01-31
Maturity Price : 25.00
Evaluated at bid price : 20.65
Bid-YTW : 5.21 % |
| BAM.PF.A |
FixedReset |
-1.40 % |
YTW SCENARIO
Maturity Type : Call
Maturity Date : 2018-09-30
Maturity Price : 25.00
Evaluated at bid price : 25.40
Bid-YTW : 4.02 % |
| PWF.PR.A |
Floater |
-1.19 % |
YTW SCENARIO
Maturity Type : Limit Maturity
Maturity Date : 2044-12-17
Maturity Price : 19.02
Evaluated at bid price : 19.02
Bid-YTW : 2.78 % |
| BAM.PR.T |
FixedReset |
-1.19 % |
YTW SCENARIO
Maturity Type : Limit Maturity
Maturity Date : 2044-12-17
Maturity Price : 23.12
Evaluated at bid price : 24.05
Bid-YTW : 3.80 % |
| PWF.PR.P |
FixedReset |
-1.16 % |
YTW SCENARIO
Maturity Type : Limit Maturity
Maturity Date : 2044-12-17
Maturity Price : 20.41
Evaluated at bid price : 20.41
Bid-YTW : 3.71 % |
| FTS.PR.H |
FixedReset |
-1.09 % |
YTW SCENARIO
Maturity Type : Limit Maturity
Maturity Date : 2044-12-17
Maturity Price : 18.10
Evaluated at bid price : 18.10
Bid-YTW : 3.87 % |
| NEW.PR.D |
SplitShare |
1.06 % |
YTW SCENARIO
Maturity Type : Call
Maturity Date : 2015-06-26
Maturity Price : 32.07
Evaluated at bid price : 32.46
Bid-YTW : 1.67 % |
| ENB.PR.N |
FixedReset |
1.10 % |
YTW SCENARIO
Maturity Type : Limit Maturity
Maturity Date : 2044-12-17
Maturity Price : 22.37
Evaluated at bid price : 23.05
Bid-YTW : 4.29 % |
| TRP.PR.E |
FixedReset |
1.28 % |
YTW SCENARIO
Maturity Type : Limit Maturity
Maturity Date : 2044-12-17
Maturity Price : 23.29
Evaluated at bid price : 25.36
Bid-YTW : 3.64 % |
| ENB.PR.H |
FixedReset |
1.62 % |
YTW SCENARIO
Maturity Type : Limit Maturity
Maturity Date : 2044-12-17
Maturity Price : 20.70
Evaluated at bid price : 20.70
Bid-YTW : 4.31 % |
| FTS.PR.K |
FixedReset |
2.35 % |
YTW SCENARIO
Maturity Type : Limit Maturity
Maturity Date : 2044-12-17
Maturity Price : 23.18
Evaluated at bid price : 24.87
Bid-YTW : 3.40 % |
| TRP.PR.A |
FixedReset |
2.57 % |
YTW SCENARIO
Maturity Type : Limit Maturity
Maturity Date : 2044-12-17
Maturity Price : 19.95
Evaluated at bid price : 19.95
Bid-YTW : 4.07 % |
| PWF.PR.T |
FixedReset |
2.88 % |
YTW SCENARIO
Maturity Type : Limit Maturity
Maturity Date : 2044-12-17
Maturity Price : 23.35
Evaluated at bid price : 25.35
Bid-YTW : 3.63 % |
| Volume Highlights |
| Issue |
Index |
Shares
Traded |
Notes |
| TD.PF.C |
FixedReset |
140,075 |
Recent new issue.
YTW SCENARIO
Maturity Type : Limit Maturity
Maturity Date : 2044-12-17
Maturity Price : 23.08
Evaluated at bid price : 24.78
Bid-YTW : 3.53 % |
| CM.PR.P |
FixedReset |
133,810 |
Recent new issue.
YTW SCENARIO
Maturity Type : Limit Maturity
Maturity Date : 2044-12-17
Maturity Price : 23.05
Evaluated at bid price : 24.71
Bid-YTW : 3.53 % |
| BAM.PR.K |
Floater |
93,724 |
Desjardins crossed 83,400 at 16.37.
YTW SCENARIO
Maturity Type : Limit Maturity
Maturity Date : 2044-12-17
Maturity Price : 16.45
Evaluated at bid price : 16.45
Bid-YTW : 3.18 % |
| BAM.PR.B |
Floater |
89,653 |
Desjardins crossed 85,300 at 16.60.
YTW SCENARIO
Maturity Type : Limit Maturity
Maturity Date : 2044-12-17
Maturity Price : 16.50
Evaluated at bid price : 16.50
Bid-YTW : 3.17 % |
| MFC.PR.N |
FixedReset |
67,100 |
Recent new issue.
YTW SCENARIO
Maturity Type : Hard Maturity
Maturity Date : 2025-01-31
Maturity Price : 25.00
Evaluated at bid price : 24.91
Bid-YTW : 3.79 % |
| TRP.PR.C |
FixedReset |
58,489 |
YTW SCENARIO
Maturity Type : Limit Maturity
Maturity Date : 2044-12-17
Maturity Price : 18.75
Evaluated at bid price : 18.75
Bid-YTW : 3.97 % |
| There were 29 other index-included issues trading in excess of 10,000 shares. |
| Wide Spread Highlights |
| Issue |
Index |
Quote Data and Yield Notes |
| MFC.PR.B |
Deemed-Retractible |
Quote: 23.24 – 23.97
Spot Rate : 0.7300
Average : 0.5425
YTW SCENARIO
Maturity Type : Hard Maturity
Maturity Date : 2025-01-31
Maturity Price : 25.00
Evaluated at bid price : 23.24
Bid-YTW : 5.60 % |
| SLF.PR.E |
Deemed-Retractible |
Quote: 22.83 – 23.36
Spot Rate : 0.5300
Average : 0.3429
YTW SCENARIO
Maturity Type : Hard Maturity
Maturity Date : 2025-01-31
Maturity Price : 25.00
Evaluated at bid price : 22.83
Bid-YTW : 5.65 % |
| ELF.PR.G |
Perpetual-Discount |
Quote: 22.90 – 23.48
Spot Rate : 0.5800
Average : 0.4147
YTW SCENARIO
Maturity Type : Limit Maturity
Maturity Date : 2044-12-17
Maturity Price : 22.61
Evaluated at bid price : 22.90
Bid-YTW : 5.26 % |
| IGM.PR.B |
Perpetual-Premium |
Quote: 25.72 – 26.30
Spot Rate : 0.5800
Average : 0.4180
YTW SCENARIO
Maturity Type : Call
Maturity Date : 2018-12-31
Maturity Price : 25.00
Evaluated at bid price : 25.72
Bid-YTW : 5.34 % |
| CGI.PR.D |
SplitShare |
Quote: 25.25 – 25.93
Spot Rate : 0.6800
Average : 0.5192
YTW SCENARIO
Maturity Type : Soft Maturity
Maturity Date : 2023-06-14
Maturity Price : 25.00
Evaluated at bid price : 25.25
Bid-YTW : 3.63 % |
| ENB.PR.Y |
FixedReset |
Quote: 21.70 – 22.15
Spot Rate : 0.4500
Average : 0.2903
YTW SCENARIO
Maturity Type : Limit Maturity
Maturity Date : 2044-12-17
Maturity Price : 21.43
Evaluated at bid price : 21.70
Bid-YTW : 4.35 % |