DBRS reports that the ABCP Clean-up Vehicle is underpaying its first interest payment:
notice delivered by BlackRock (Institutional) Canada Ltd. (the Administrator) regarding the first payment date for Master Asset Vehicle I and Master Asset Vehicle II (collectively, the MAVs).
The notice advised that insufficient proceeds would be available to pay accrued interest in its entirety on the Class A-1 Notes and Class A-2 Notes (collectively, the Class A Notes). The Administrator identified the following three factors that it believes contributed to the interest shortfall:
(1) The MAVs were required to pay certain expenses related to the closing of the transaction.
(2) There was an abbreviated first interest period and a mismatch in the payment dates for certain underlying assets.
(3) A fixed-floating interest rate mismatch exists between the margin funding facility fees and the return generated by the underlying assets.
As outlined in the MAV rating reports published on January 21, 2009, the rating of the Class A Notes addresses the payment of interest as set out in the terms of the transaction documents. According to their respective Trust Indentures, the MAVs have no legal obligation to pay interest before January 22, 2019. Therefore, no negative rating action will result from the failure to pay the full amount of accrued interest on the Class A Notes on any given payment date. However, if after reviewing the first payment date report, DBRS determines that expenses and/or proceeds from the underlying assets are materially different from what was originally modelled, negative rating action may be required.
The saga just never ends, does it?
The Globe & Mail reports more pressure for captive pension managers to become commercial asset managers:
Michael Nobrega, chief executive officer of the Ontario Municipal Employees Retirement System (OMERS), said yesterday that his fund is now open for business and is actively seeking mandates to manage other pension funds’ assets.
…
And while Mr. Nobrega said OMERS should become a superfund manager, he insisted his vision is not motivated by a personal desire to build an empire.“This is not about Michael Nobrega trying to be president of a superfund,” he told reporters yesterday. “This is about what’s right for plan members. You need resources to manage these [plans]. These are very complex areas.”
There are a number of things that are massively wrong – well, suspicious, anyway – about this idea:
- Regardless of Mr. Nobrega’s personal motivations, concious and unconcious, turning a captive asset manager into just another asset management firm will change the culture. Sales is anti-thetical to performance; and once third-party run-awayable assets become important to the organization, then it’s bang, game over.
- I still see no evidence that large managers outperform small managers, or even medium-size managers. Take a look at all the biggest firms you can think of: they will tell you their headcount, they tout their Assets-under-management, they wax ecstatic about their multiplicity of offices that ensures that clients can be taken out to lunch no matter where they are …. but don’t spend too much time looking for audited performance reports, compliant with what are rather hopefully described as industry standards, unless you want to get as cynical as I am
- Private equity is – at least to some extent – a shell game. The reason you take something private is so that you can discount the expected cash flows from the private entity in your own way rather than marking to market; a bit like the infamous Level 3 Assets that people get so upset about. I will not suggest that private equity is not a good idea; I’ll just say that I suspect returns are subject to inherent smoothing
- Superfunds? Am I lekniW naV piR, the only guy in town who’s been awake for the past twenty years? One of the great scandal-shock-horrors of the recent credit crisis has been the discovery that some banks are too big to fail and that the cost of bail-outs represents an unprecedented strain on public finances. Willem Buiter, particularly, has been scornful of financial systems in which the banking system is not only concentrated, but large relative to GDP. What happens if a superfund gets into trouble? McGuinty is already wetting his pants about the prospect of having to bail-out (or take the political heat for not bailing out) a little rinky-dink plan like GM Canada. Do we really want to take the chance that half (at least) of all Ontario plans are going to make the same Big Bad Mistake?
- And there’s market influence. A certain teflon-coated regional superfund recently took investment action that had the effect of rigging the market in Canadian ABCP (whatever its intentions may have been; and it with some help from its allies) and remember? When it went bust it went bust big-time and in a hurry. Who is prepared to guarantee to me that that won’t happen again? Don’t waste my time snivelling that Bad People will be Frowned At. Guarantee that it won’t happen.
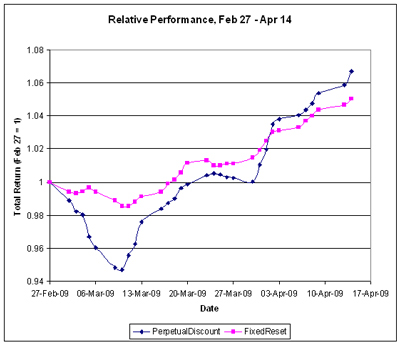
Very good volume today, with the market slightly off; FixedResets might have been adversely affected by news of $300-million+ new supply from RY.
| HIMIPref™ Preferred Indices These values reflect the December 2008 revision of the HIMIPref™ Indices Values are provisional and are finalized monthly |
|||||||
| Index | Mean Current Yield (at bid) |
Median YTW |
Median Average Trading Value |
Median Mod Dur (YTW) |
Issues | Day’s Perf. | Index Value |
| Ratchet | 0.00 % | 0.00 % | 0 | 0.00 | 0 | 0.0000 % | 955.0 |
| FixedFloater | 0.00 % | 0.00 % | 0 | 0.00 | 0 | 0.0000 % | 1,544.4 |
| Floater | 5.11 % | 5.13 % | 71,413 | 15.28 | 2 | 0.0000 % | 1,193.1 |
| OpRet | 5.10 % | 4.35 % | 145,526 | 3.70 | 15 | 0.1098 % | 2,134.4 |
| SplitShare | 6.67 % | 8.81 % | 47,196 | 5.63 | 3 | 0.0172 % | 1,733.2 |
| Interest-Bearing | 6.15 % | 9.87 % | 26,570 | 0.67 | 1 | 0.1026 % | 1,939.5 |
| Perpetual-Premium | 0.00 % | 0.00 % | 0 | 0.00 | 0 | -0.0165 % | 1,630.7 |
| Perpetual-Discount | 6.70 % | 6.78 % | 145,470 | 12.78 | 71 | -0.0165 % | 1,501.9 |
| FixedReset | 5.96 % | 5.43 % | 672,877 | 4.57 | 35 | -0.2409 % | 1,896.0 |
| Performance Highlights | |||
| Issue | Index | Change | Notes |
| W.PR.J | Perpetual-Discount | -2.75 % | YTW SCENARIO Maturity Type : Limit Maturity Maturity Date : 2039-04-21 Maturity Price : 20.17 Evaluated at bid price : 20.17 Bid-YTW : 7.01 % |
| GWO.PR.I | Perpetual-Discount | -2.57 % | YTW SCENARIO Maturity Type : Limit Maturity Maturity Date : 2039-04-21 Maturity Price : 15.90 Evaluated at bid price : 15.90 Bid-YTW : 7.17 % |
| MFC.PR.C | Perpetual-Discount | -2.13 % | YTW SCENARIO Maturity Type : Limit Maturity Maturity Date : 2039-04-21 Maturity Price : 16.54 Evaluated at bid price : 16.54 Bid-YTW : 6.91 % |
| BAM.PR.N | Perpetual-Discount | -1.53 % | YTW SCENARIO Maturity Type : Limit Maturity Maturity Date : 2039-04-21 Maturity Price : 14.15 Evaluated at bid price : 14.15 Bid-YTW : 8.52 % |
| TD.PR.A | FixedReset | -1.48 % | YTW SCENARIO Maturity Type : Limit Maturity Maturity Date : 2039-04-21 Maturity Price : 23.23 Evaluated at bid price : 23.27 Bid-YTW : 4.35 % |
| IAG.PR.A | Perpetual-Discount | -1.38 % | YTW SCENARIO Maturity Type : Limit Maturity Maturity Date : 2039-04-21 Maturity Price : 15.71 Evaluated at bid price : 15.71 Bid-YTW : 7.42 % |
| TD.PR.S | FixedReset | -1.31 % | YTW SCENARIO Maturity Type : Limit Maturity Maturity Date : 2039-04-21 Maturity Price : 22.47 Evaluated at bid price : 22.55 Bid-YTW : 4.14 % |
| TD.PR.G | FixedReset | -1.27 % | YTW SCENARIO Maturity Type : Call Maturity Date : 2014-05-30 Maturity Price : 25.00 Evaluated at bid price : 25.62 Bid-YTW : 5.69 % |
| RY.PR.L | FixedReset | -1.16 % | YTW SCENARIO Maturity Type : Limit Maturity Maturity Date : 2039-04-21 Maturity Price : 24.21 Evaluated at bid price : 24.26 Bid-YTW : 4.88 % |
| CL.PR.B | Perpetual-Discount | -1.15 % | YTW SCENARIO Maturity Type : Limit Maturity Maturity Date : 2039-04-21 Maturity Price : 21.81 Evaluated at bid price : 22.29 Bid-YTW : 7.08 % |
| BNS.PR.N | Perpetual-Discount | -1.15 % | YTW SCENARIO Maturity Type : Limit Maturity Maturity Date : 2039-04-21 Maturity Price : 20.66 Evaluated at bid price : 20.66 Bid-YTW : 6.39 % |
| POW.PR.B | Perpetual-Discount | -1.06 % | YTW SCENARIO Maturity Type : Limit Maturity Maturity Date : 2039-04-21 Maturity Price : 18.75 Evaluated at bid price : 18.75 Bid-YTW : 7.21 % |
| CM.PR.J | Perpetual-Discount | -1.02 % | YTW SCENARIO Maturity Type : Limit Maturity Maturity Date : 2039-04-21 Maturity Price : 16.51 Evaluated at bid price : 16.51 Bid-YTW : 6.86 % |
| CM.PR.P | Perpetual-Discount | 1.06 % | YTW SCENARIO Maturity Type : Limit Maturity Maturity Date : 2039-04-21 Maturity Price : 20.00 Evaluated at bid price : 20.00 Bid-YTW : 6.92 % |
| NA.PR.K | Perpetual-Discount | 1.07 % | YTW SCENARIO Maturity Type : Limit Maturity Maturity Date : 2039-04-21 Maturity Price : 21.78 Evaluated at bid price : 21.78 Bid-YTW : 6.74 % |
| BMO.PR.J | Perpetual-Discount | 1.11 % | YTW SCENARIO Maturity Type : Limit Maturity Maturity Date : 2039-04-21 Maturity Price : 18.20 Evaluated at bid price : 18.20 Bid-YTW : 6.30 % |
| SLF.PR.A | Perpetual-Discount | 1.12 % | YTW SCENARIO Maturity Type : Limit Maturity Maturity Date : 2039-04-21 Maturity Price : 17.15 Evaluated at bid price : 17.15 Bid-YTW : 7.02 % |
| PWF.PR.I | Perpetual-Discount | 1.21 % | YTW SCENARIO Maturity Type : Limit Maturity Maturity Date : 2039-04-21 Maturity Price : 21.82 Evaluated at bid price : 21.82 Bid-YTW : 6.92 % |
| ELF.PR.G | Perpetual-Discount | 1.44 % | YTW SCENARIO Maturity Type : Limit Maturity Maturity Date : 2039-04-21 Maturity Price : 14.81 Evaluated at bid price : 14.81 Bid-YTW : 8.11 % |
| RY.PR.B | Perpetual-Discount | 1.45 % | YTW SCENARIO Maturity Type : Limit Maturity Maturity Date : 2039-04-21 Maturity Price : 18.82 Evaluated at bid price : 18.82 Bid-YTW : 6.25 % |
| BAM.PR.O | OpRet | 1.61 % | YTW SCENARIO Maturity Type : Option Certainty Maturity Date : 2013-06-30 Maturity Price : 25.00 Evaluated at bid price : 22.76 Bid-YTW : 7.66 % |
| HSB.PR.C | Perpetual-Discount | 1.76 % | YTW SCENARIO Maturity Type : Limit Maturity Maturity Date : 2039-04-21 Maturity Price : 19.04 Evaluated at bid price : 19.04 Bid-YTW : 6.78 % |
| BMO.PR.M | FixedReset | 4.26 % | YTW SCENARIO Maturity Type : Limit Maturity Maturity Date : 2039-04-21 Maturity Price : 24.19 Evaluated at bid price : 24.25 Bid-YTW : 3.91 % |
| Volume Highlights | |||
| Issue | Index | Shares Traded |
Notes |
| RY.PR.X | FixedReset | 168,135 | Recent new issue. YTW SCENARIO Maturity Type : Call Maturity Date : 2014-09-23 Maturity Price : 25.00 Evaluated at bid price : 25.65 Bid-YTW : 5.80 % |
| TD.PR.K | FixedReset | 146,543 | Recent new issue. YTW SCENARIO Maturity Type : Call Maturity Date : 2014-08-30 Maturity Price : 25.00 Evaluated at bid price : 25.53 Bid-YTW : 5.89 % |
| MFC.PR.D | FixedReset | 87,367 | Scotia bought 12,800 from National at 25.80. YTW SCENARIO Maturity Type : Call Maturity Date : 2014-07-19 Maturity Price : 25.00 Evaluated at bid price : 25.57 Bid-YTW : 6.32 % |
| PWF.PR.F | Perpetual-Discount | 79,680 | Nesbitt bought two blocks of 10,000 each from TD, both at 19.00; Scotia crossed 36,000 at 19.10. YTW SCENARIO Maturity Type : Limit Maturity Maturity Date : 2039-04-21 Maturity Price : 18.87 Evaluated at bid price : 18.87 Bid-YTW : 7.00 % |
| HSB.PR.E | FixedReset | 76,120 | Recent new issue. YTW SCENARIO Maturity Type : Call Maturity Date : 2014-07-30 Maturity Price : 25.00 Evaluated at bid price : 25.30 Bid-YTW : 6.47 % |
| MFC.PR.A | OpRet | 63,083 | Scotia crossed 45,900 at 24.76. YTW SCENARIO Maturity Type : Soft Maturity Maturity Date : 2015-12-18 Maturity Price : 25.00 Evaluated at bid price : 24.76 Bid-YTW : 4.35 % |
| There were 51 other index-included issues trading in excess of 10,000 shares. | |||