Today’s big news was the BoC rate announcement:
The Bank of Canada today announced that it is maintaining its target for the overnight rate at 1/2 per cent. The Bank Rate is correspondingly 3/4 per cent and the deposit rate is 1/4 per cent.
Inflation in Canada is evolving broadly as expected. Total CPI inflation remains near the bottom of the Bank’s target range as the disinflationary effects of economic slack and low consumer energy prices are only partially offset by the inflationary impact of the lower Canadian dollar on the prices of imported goods. As all of these factors dissipate, the Bank expects inflation will rise to about 2 per cent by early 2017. Measures of core inflation should remain close to 2 per cent.
….
The Bank projects Canada’s economy will grow by about 1 1/2 per cent in 2016 and 2 1/2 per cent in 2017. The complex nature of the ongoing structural adjustment makes the outlook for demand and potential output highly uncertain. The Bank’s current base case projection shows the output gap closing later than was anticipated in October, around the end of 2017. However, the Bank has not yet incorporated the positive impact of fiscal measures expected in the next federal budget.All things considered, therefore, the risks to the profile for inflation are roughly balanced. Meanwhile, financial vulnerabilities continue to edge higher, as expected. The Bank’s Governing Council judges that the current stance of monetary policy is appropriate, and the target for the overnight rate remains at 1/2 per cent.
This was good news for some:
The loonie, as the Canadian dollar is known for the image of the aquatic bird on the C$1 coin, gained 0.7 percent to C$1.4476 per U.S. dollar at 3:30 p.m. in Toronto. One Canadian dollar buys about 69 U.S. cents. The loonie reached the cheapest since April 2003 on Wednesday before the rate announcement.
In what may be a harbinger of things to come, Pacific Exploration & Production Corp. (formerly Pacific Rubiales Energy Corp.) has run into serious trouble:
it has elected to utilize the 30 day grace period (the “Grace Period”) pursuant to the indentures governing its 5.625% notes due January 19, 2025 (the “5.625% Notes”) and its 5.375% notes due January 26, 2019 (the “5.375 Notes”, and together with the 5.625% Notes, the “Notes”) rather than make the interest payments due on January 19, 2016 and January 26, 2016, respectively, in connection with these Notes.
Specifically, the following interest payments will not be paid on the scheduled payment dates: (i) U.S.$31.3 million in the aggregate in respect of the 5.625% Notes scheduled to be paid on January 19, 2016; and (ii) U.S.$34.9 million in the aggregate in respect of the 5.375% Notes scheduled to be paid on January 26, 2016 (collectively, the “January Interest Payments”). The Company has elected to use the Grace Period to assess strategic alternatives with respect to its capital structure.
The Company’s current liquidity position is being impacted by the significantly depressed international oil prices. The Company will use the Grace Period to engage with its creditors (including its lenders and holders of each series of the Company’s notes) with a view to making its capital structure more suitable to current market conditions. The Company remains and intends to remain current with its suppliers, trade partners and contractors. Normal operations continue in Colombia and the other jurisdictions within which the Company operates.
The failure to make the January Interest Payments on the scheduled dates does not constitute an Event of Default under the indentures that govern the Notes. In each case, the Company has a 30 day period from the scheduled payment dates to cure the failure to make such payments and the Company reserves the right to make the January Interest Payments prior to the expiry of each Grace Period.
This follows some circling by the vultures:
Harbour Energy, managed by EIG Global Energy Partners (“EIG”), believes that Pacific E&P faces significant near-term insolvency concerns and requires a large infusion of new capital in order to restructure its balance sheet, avoid value-destructive asset-level reorganizations or distressed sales, and degradation of Pacific E&P’s assets through under-investment and deferred maintenance. As of September 30, 2015, Pacific E&P had approximately $5.4 billion of debt outstanding, including $4.10 billion aggregate principal amount of senior bonds that are trading at levels equivalent to approximately thirteen cents on the dollar as of January 13, 2016, indicating that no value remains in its equity. Harbour Energy and EIG are committed to investing in Pacific E&P to ensure that its operations remain intact, partnerships are maintained and, upon restructuring, Pacific E&P is once again positioned for operational excellence and growth.
… with more pressure being added today:
It appears highly unlikely that Pacific E&P will make the deferred interest payments on the 2019 Notes and the 2025 Notes nor make interest payments on the 2021 Notes or the 2023 Notes when due. However, for those that tender, because Harbour Energy’s offer includes all accrued and unpaid interest payments across all four tranches of Notes up to the end of the Company’s 30-day grace period on February 19, 2016 (assuming the company does not file for insolvency prior to that), EIG’s Tender Offer consideration of $175 per $1,000 of principal plus accrued interest is effectively $200.66 per $1,000 of principal on average across all four tranches of Notes.
“With an average effective price of approximately 20.1%, our offer represents a 100% premium over the average 10% bid price where Pacific E&P’s bonds were trading immediately before our offer was launched and when the market expected the Company to make its January interest payments. We believe the Company’s cash position is dire and that the market has underestimated the severity of the situation. …. ”
Added Mr. Thomas, “We are grateful for the bondholders who have already indicated they will tender. We believe our proposal represents the best outcome for Pacific E&P as well as the bondholders as it provides a significant premium and de-risks recovery in a comprehensive and credible way. In our view, a single voice which is prepared to support further growth of the Company in partnership with Pacific E&P’s management and other stakeholders is the only viable solution.”
Meanwhile, preferred share investors were treated to another day of watching the market:

Click for Big
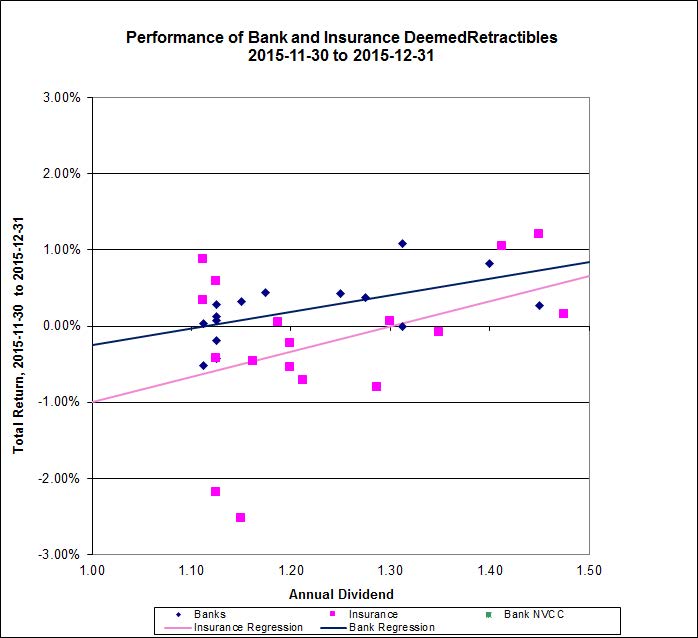
It was a grim day for the Canadian preferred share market, with PerpetualDiscounts off 118bp, FixedResets losing 205bp and DeemedRetractibles down 163bp. The Performance Highlights table is ridiculous. Volume was extremely high.
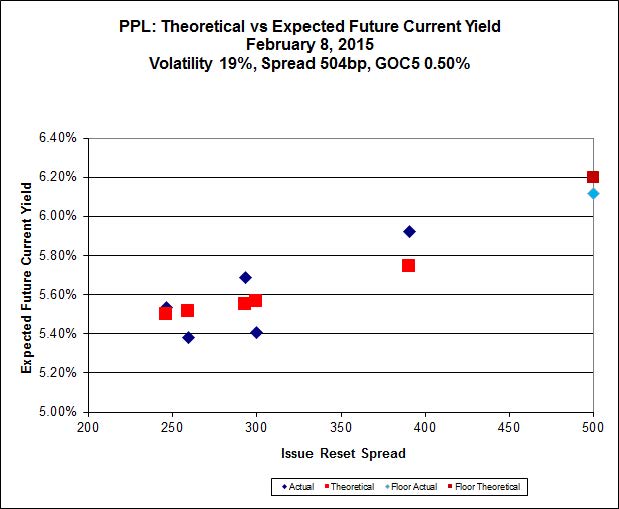
For as long as the FixedReset market is so violently unsettled, I’ll keep publishing updates of the more interesting and meaningful series of FixedResets’ Implied Volatilities. This doesn’t include Enbridge because although Enbridge has a large number of issues outstanding, all of which are quite liquid, the range of Issue Reset Spreads is too small for decent conclusions. The low is 212bp (ENB.PR.H; second-lowest is ENB.PR.D at 237bp) and the high is a mere 268 for ENB.PF.G.
Remember that all rich /cheap assessments are:
» based on Implied Volatility Theory only
» are relative only to other FixedResets from the same issuer
» assume constant GOC-5 yield
» assume constant Implied Volatility
» assume constant spread
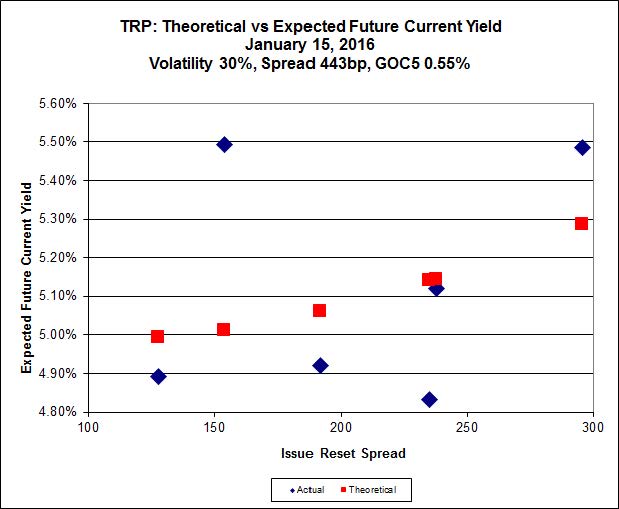
Here’s TRP:

Click for Big
TRP.PR.E, which resets 2019-10-30 at +235, is bid at 15.61 to be $0.92 rich, while TRP.PR.A, resetting 2019-12-31 at +192, is $0.52 cheap at its bid price of 12.21.

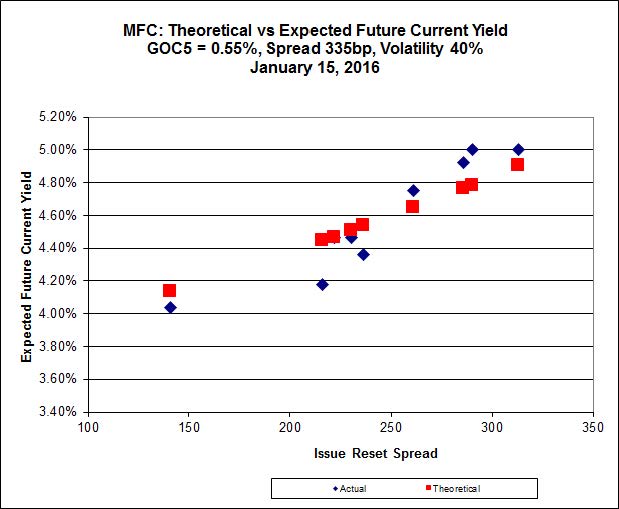
Click for Big
Most expensive is MFC.PR.L, resetting at +216bp on 2019-6-19, bid at 15.60 to be 0.73 rich, while MFC.PR.G, resetting at +290bp on 2016-12-19, is bid at 16.85 to be 0.75 cheap.

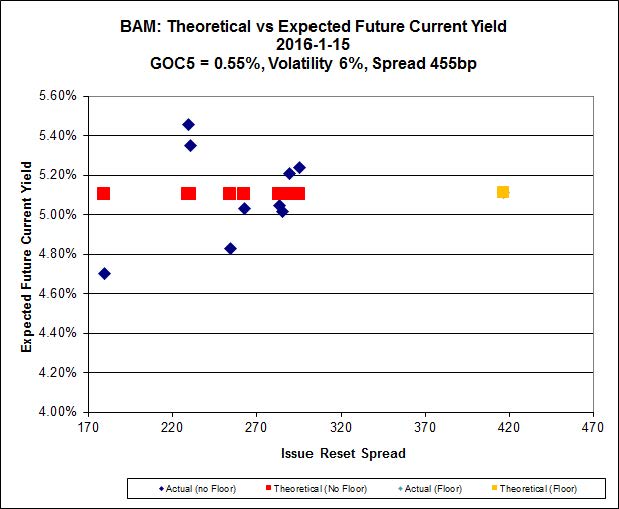
Click for Big
The cheapest issue relative to its peers is BAM.PR.R, resetting at +230bp on 2016-6-30, bid at 13.05 to be $1.63 cheap. BAM.PF.E, resetting at +255bp on 2020-3-31 is bid at 16.95 and appears to be $1.02 rich.

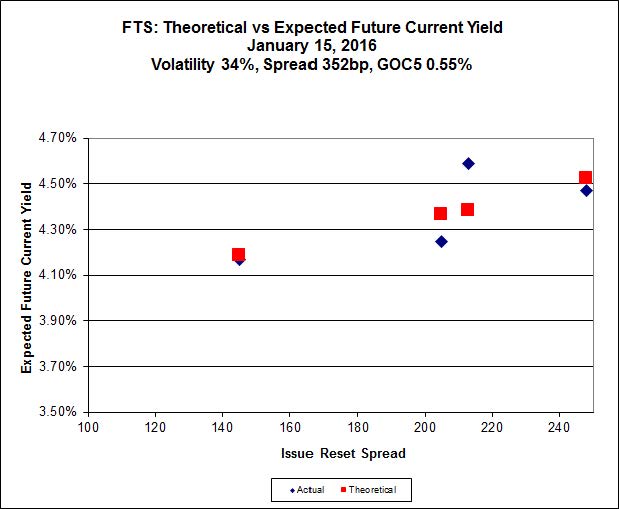
Click for Big
FTS.PR.K, with a spread of +205bp, and bid at 14.89, looks $0.63 expensive and resets 2019-3-1. FTS.PR.G, with a spread of +213bp and resetting 2018-9-1, is bid at 14.30 and is $0.34 cheap.

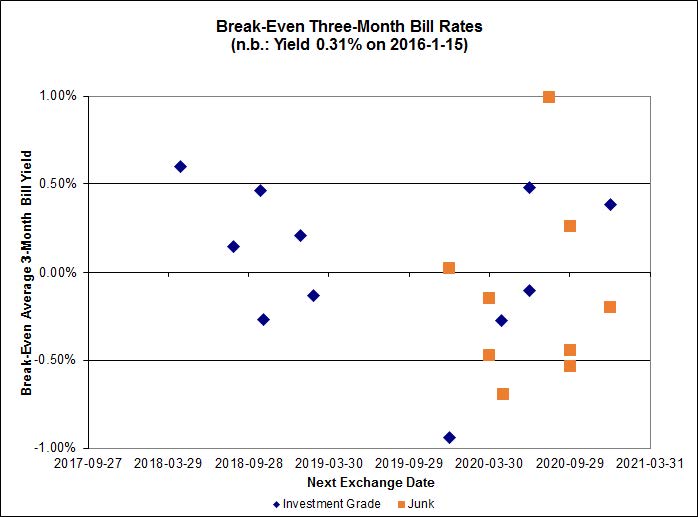
Click for Big
Investment-grade pairs predict an average three-month bill yield over the next five-odd years of -0.04%, with no outliers. There are two junk outliers below -1.00% and one above 1.00%.

Click for Big
Shall we just say that this exhibits a high level of confidence in the continued rapacity of Canadian banks?
| HIMIPref™ Preferred Indices These values reflect the December 2008 revision of the HIMIPref™ Indices Values are provisional and are finalized monthly |
|||||||
| Index | Mean Current Yield (at bid) |
Median YTW |
Median Average Trading Value |
Median Mod Dur (YTW) |
Issues | Day’s Perf. | Index Value |
| Ratchet | 6.19 % | 7.49 % | 22,797 | 14.87 | 1 | -11.6935 % | 1,255.5 |
| FixedFloater | 7.88 % | 6.87 % | 30,509 | 15.40 | 1 | -3.5200 % | 2,523.8 |
| Floater | 4.89 % | 4.99 % | 76,197 | 15.53 | 4 | 0.2074 % | 1,563.1 |
| OpRet | 0.00 % | 0.00 % | 0 | 0.00 | 0 | -0.0837 % | 2,687.3 |
| SplitShare | 4.92 % | 6.83 % | 68,931 | 2.73 | 6 | -0.0837 % | 3,144.6 |
| Interest-Bearing | 0.00 % | 0.00 % | 0 | 0.00 | 0 | -0.0837 % | 2,453.6 |
| Perpetual-Premium | 6.04 % | 6.07 % | 85,813 | 13.81 | 6 | -0.8657 % | 2,443.0 |
| Perpetual-Discount | 6.01 % | 6.06 % | 101,126 | 13.80 | 33 | -1.1848 % | 2,391.7 |
| FixedReset | 5.97 % | 5.12 % | 243,510 | 14.59 | 82 | -2.0519 % | 1,726.9 |
| Deemed-Retractible | 5.49 % | 5.94 % | 132,717 | 6.92 | 34 | -1.6340 % | 2,450.5 |
| FloatingReset | 2.86 % | 5.19 % | 64,247 | 5.60 | 13 | -1.4756 % | 1,945.1 |
| Performance Highlights | |||
| Issue | Index | Change | Notes |
| SLF.PR.J | FloatingReset | -11.83 % | YTW SCENARIO Maturity Type : Hard Maturity Maturity Date : 2025-01-31 Maturity Price : 25.00 Evaluated at bid price : 10.58 Bid-YTW : 12.65 % |
| BAM.PR.E | Ratchet | -11.69 % | YTW SCENARIO Maturity Type : Limit Maturity Maturity Date : 2046-01-20 Maturity Price : 25.00 Evaluated at bid price : 10.95 Bid-YTW : 7.49 % |
| BAM.PR.K | Floater | -9.47 % | YTW SCENARIO Maturity Type : Limit Maturity Maturity Date : 2046-01-20 Maturity Price : 8.60 Evaluated at bid price : 8.60 Bid-YTW : 5.55 % |
| FTS.PR.M | FixedReset | -7.25 % | YTW SCENARIO Maturity Type : Limit Maturity Maturity Date : 2046-01-20 Maturity Price : 16.00 Evaluated at bid price : 16.00 Bid-YTW : 5.20 % |
| FTS.PR.H | FixedReset | -5.84 % | YTW SCENARIO Maturity Type : Limit Maturity Maturity Date : 2046-01-20 Maturity Price : 11.28 Evaluated at bid price : 11.28 Bid-YTW : 4.79 % |
| HSE.PR.A | FixedReset | -5.79 % | YTW SCENARIO Maturity Type : Limit Maturity Maturity Date : 2046-01-20 Maturity Price : 8.30 Evaluated at bid price : 8.30 Bid-YTW : 6.99 % |
| TRP.PR.F | FloatingReset | -5.62 % | YTW SCENARIO Maturity Type : Limit Maturity Maturity Date : 2046-01-20 Maturity Price : 10.75 Evaluated at bid price : 10.75 Bid-YTW : 5.23 % |
| HSE.PR.G | FixedReset | -5.52 % | YTW SCENARIO Maturity Type : Limit Maturity Maturity Date : 2046-01-20 Maturity Price : 14.20 Evaluated at bid price : 14.20 Bid-YTW : 7.57 % |
| MFC.PR.K | FixedReset | -5.48 % | YTW SCENARIO Maturity Type : Hard Maturity Maturity Date : 2025-01-31 Maturity Price : 25.00 Evaluated at bid price : 15.35 Bid-YTW : 9.78 % |
| SLF.PR.E | Deemed-Retractible | -5.29 % | YTW SCENARIO Maturity Type : Hard Maturity Maturity Date : 2025-01-31 Maturity Price : 25.00 Evaluated at bid price : 18.62 Bid-YTW : 8.73 % |
| MFC.PR.L | FixedReset | -5.05 % | YTW SCENARIO Maturity Type : Hard Maturity Maturity Date : 2025-01-31 Maturity Price : 25.00 Evaluated at bid price : 15.60 Bid-YTW : 9.70 % |
| HSE.PR.C | FixedReset | -4.75 % | YTW SCENARIO Maturity Type : Limit Maturity Maturity Date : 2046-01-20 Maturity Price : 13.43 Evaluated at bid price : 13.43 Bid-YTW : 7.37 % |
| SLF.PR.C | Deemed-Retractible | -4.70 % | YTW SCENARIO Maturity Type : Hard Maturity Maturity Date : 2025-01-31 Maturity Price : 25.00 Evaluated at bid price : 18.64 Bid-YTW : 8.65 % |
| HSE.PR.E | FixedReset | -4.63 % | YTW SCENARIO Maturity Type : Limit Maturity Maturity Date : 2046-01-20 Maturity Price : 14.20 Evaluated at bid price : 14.20 Bid-YTW : 7.56 % |
| FTS.PR.K | FixedReset | -4.49 % | YTW SCENARIO Maturity Type : Limit Maturity Maturity Date : 2046-01-20 Maturity Price : 14.89 Evaluated at bid price : 14.89 Bid-YTW : 4.87 % |
| SLF.PR.D | Deemed-Retractible | -4.37 % | YTW SCENARIO Maturity Type : Hard Maturity Maturity Date : 2025-01-31 Maturity Price : 25.00 Evaluated at bid price : 18.60 Bid-YTW : 8.68 % |
| SLF.PR.G | FixedReset | -4.37 % | YTW SCENARIO Maturity Type : Hard Maturity Maturity Date : 2025-01-31 Maturity Price : 25.00 Evaluated at bid price : 12.05 Bid-YTW : 11.62 % |
| TRP.PR.A | FixedReset | -4.31 % | YTW SCENARIO Maturity Type : Limit Maturity Maturity Date : 2046-01-20 Maturity Price : 12.21 Evaluated at bid price : 12.21 Bid-YTW : 5.51 % |
| BAM.PF.G | FixedReset | -4.00 % | YTW SCENARIO Maturity Type : Limit Maturity Maturity Date : 2046-01-20 Maturity Price : 17.52 Evaluated at bid price : 17.52 Bid-YTW : 5.30 % |
| SLF.PR.A | Deemed-Retractible | -3.92 % | YTW SCENARIO Maturity Type : Hard Maturity Maturity Date : 2025-01-31 Maturity Price : 25.00 Evaluated at bid price : 19.85 Bid-YTW : 8.10 % |
| MFC.PR.F | FixedReset | -3.90 % | YTW SCENARIO Maturity Type : Hard Maturity Maturity Date : 2025-01-31 Maturity Price : 25.00 Evaluated at bid price : 11.34 Bid-YTW : 12.36 % |
| RY.PR.M | FixedReset | -3.77 % | YTW SCENARIO Maturity Type : Limit Maturity Maturity Date : 2046-01-20 Maturity Price : 16.84 Evaluated at bid price : 16.84 Bid-YTW : 4.97 % |
| RY.PR.J | FixedReset | -3.73 % | YTW SCENARIO Maturity Type : Limit Maturity Maturity Date : 2046-01-20 Maturity Price : 17.02 Evaluated at bid price : 17.02 Bid-YTW : 5.04 % |
| BAM.PR.R | FixedReset | -3.62 % | YTW SCENARIO Maturity Type : Limit Maturity Maturity Date : 2046-01-20 Maturity Price : 13.05 Evaluated at bid price : 13.05 Bid-YTW : 5.62 % |
| SLF.PR.B | Deemed-Retractible | -3.57 % | YTW SCENARIO Maturity Type : Hard Maturity Maturity Date : 2025-01-31 Maturity Price : 25.00 Evaluated at bid price : 20.00 Bid-YTW : 8.05 % |
| BAM.PR.G | FixedFloater | -3.52 % | YTW SCENARIO Maturity Type : Limit Maturity Maturity Date : 2046-01-20 Maturity Price : 25.00 Evaluated at bid price : 12.06 Bid-YTW : 6.87 % |
| IAG.PR.A | Deemed-Retractible | -3.34 % | YTW SCENARIO Maturity Type : Hard Maturity Maturity Date : 2025-01-31 Maturity Price : 25.00 Evaluated at bid price : 19.99 Bid-YTW : 7.82 % |
| BAM.PR.C | Floater | -3.32 % | YTW SCENARIO Maturity Type : Limit Maturity Maturity Date : 2046-01-20 Maturity Price : 9.33 Evaluated at bid price : 9.33 Bid-YTW : 5.11 % |
| PWF.PR.S | Perpetual-Discount | -3.25 % | YTW SCENARIO Maturity Type : Limit Maturity Maturity Date : 2046-01-20 Maturity Price : 19.95 Evaluated at bid price : 19.95 Bid-YTW : 6.05 % |
| MFC.PR.J | FixedReset | -3.14 % | YTW SCENARIO Maturity Type : Hard Maturity Maturity Date : 2025-01-31 Maturity Price : 25.00 Evaluated at bid price : 16.35 Bid-YTW : 9.24 % |
| TD.PF.A | FixedReset | -3.11 % | YTW SCENARIO Maturity Type : Limit Maturity Maturity Date : 2046-01-20 Maturity Price : 16.20 Evaluated at bid price : 16.20 Bid-YTW : 4.68 % |
| TD.PR.S | FixedReset | -3.06 % | YTW SCENARIO Maturity Type : Hard Maturity Maturity Date : 2022-01-31 Maturity Price : 25.00 Evaluated at bid price : 22.15 Bid-YTW : 4.91 % |
| MFC.PR.N | FixedReset | -2.99 % | YTW SCENARIO Maturity Type : Hard Maturity Maturity Date : 2025-01-31 Maturity Price : 25.00 Evaluated at bid price : 15.92 Bid-YTW : 9.56 % |
| MFC.PR.M | FixedReset | -2.99 % | YTW SCENARIO Maturity Type : Hard Maturity Maturity Date : 2025-01-31 Maturity Price : 25.00 Evaluated at bid price : 16.25 Bid-YTW : 9.34 % |
| BAM.PR.T | FixedReset | -2.98 % | YTW SCENARIO Maturity Type : Limit Maturity Maturity Date : 2046-01-20 Maturity Price : 13.99 Evaluated at bid price : 13.99 Bid-YTW : 5.37 % |
| BMO.PR.Y | FixedReset | -2.94 % | YTW SCENARIO Maturity Type : Limit Maturity Maturity Date : 2046-01-20 Maturity Price : 17.85 Evaluated at bid price : 17.85 Bid-YTW : 4.84 % |
| IFC.PR.C | FixedReset | -2.91 % | YTW SCENARIO Maturity Type : Hard Maturity Maturity Date : 2025-01-31 Maturity Price : 25.00 Evaluated at bid price : 15.00 Bid-YTW : 10.28 % |
| SLF.PR.H | FixedReset | -2.88 % | YTW SCENARIO Maturity Type : Hard Maturity Maturity Date : 2025-01-31 Maturity Price : 25.00 Evaluated at bid price : 13.50 Bid-YTW : 11.10 % |
| BIP.PR.B | FixedReset | -2.84 % | YTW SCENARIO Maturity Type : Limit Maturity Maturity Date : 2046-01-20 Maturity Price : 21.55 Evaluated at bid price : 21.87 Bid-YTW : 6.37 % |
| TD.PF.B | FixedReset | -2.84 % | YTW SCENARIO Maturity Type : Limit Maturity Maturity Date : 2046-01-20 Maturity Price : 16.10 Evaluated at bid price : 16.10 Bid-YTW : 4.70 % |
| MFC.PR.C | Deemed-Retractible | -2.83 % | YTW SCENARIO Maturity Type : Hard Maturity Maturity Date : 2025-01-31 Maturity Price : 25.00 Evaluated at bid price : 18.89 Bid-YTW : 8.55 % |
| SLF.PR.I | FixedReset | -2.76 % | YTW SCENARIO Maturity Type : Hard Maturity Maturity Date : 2025-01-31 Maturity Price : 25.00 Evaluated at bid price : 15.51 Bid-YTW : 9.95 % |
| FTS.PR.G | FixedReset | -2.72 % | YTW SCENARIO Maturity Type : Limit Maturity Maturity Date : 2046-01-20 Maturity Price : 14.30 Evaluated at bid price : 14.30 Bid-YTW : 5.10 % |
| TD.PR.Y | FixedReset | -2.69 % | YTW SCENARIO Maturity Type : Hard Maturity Maturity Date : 2022-01-31 Maturity Price : 25.00 Evaluated at bid price : 22.40 Bid-YTW : 4.90 % |
| BAM.PR.X | FixedReset | -2.69 % | YTW SCENARIO Maturity Type : Limit Maturity Maturity Date : 2046-01-20 Maturity Price : 12.65 Evaluated at bid price : 12.65 Bid-YTW : 5.06 % |
| MFC.PR.B | Deemed-Retractible | -2.62 % | YTW SCENARIO Maturity Type : Hard Maturity Maturity Date : 2025-01-31 Maturity Price : 25.00 Evaluated at bid price : 19.32 Bid-YTW : 8.40 % |
| BMO.PR.M | FixedReset | -2.62 % | YTW SCENARIO Maturity Type : Hard Maturity Maturity Date : 2022-01-31 Maturity Price : 25.00 Evaluated at bid price : 22.30 Bid-YTW : 4.95 % |
| BAM.PF.C | Perpetual-Discount | -2.57 % | YTW SCENARIO Maturity Type : Limit Maturity Maturity Date : 2046-01-20 Maturity Price : 18.59 Evaluated at bid price : 18.59 Bid-YTW : 6.60 % |
| TRP.PR.B | FixedReset | -2.53 % | YTW SCENARIO Maturity Type : Limit Maturity Maturity Date : 2046-01-20 Maturity Price : 9.64 Evaluated at bid price : 9.64 Bid-YTW : 5.02 % |
| ELF.PR.F | Perpetual-Discount | -2.44 % | YTW SCENARIO Maturity Type : Limit Maturity Maturity Date : 2046-01-20 Maturity Price : 21.17 Evaluated at bid price : 21.17 Bid-YTW : 6.31 % |
| BAM.PF.F | FixedReset | -2.43 % | YTW SCENARIO Maturity Type : Limit Maturity Maturity Date : 2046-01-20 Maturity Price : 18.10 Evaluated at bid price : 18.10 Bid-YTW : 5.08 % |
| RY.PR.H | FixedReset | -2.37 % | YTW SCENARIO Maturity Type : Limit Maturity Maturity Date : 2046-01-20 Maturity Price : 16.50 Evaluated at bid price : 16.50 Bid-YTW : 4.67 % |
| BAM.PR.M | Perpetual-Discount | -2.35 % | YTW SCENARIO Maturity Type : Limit Maturity Maturity Date : 2046-01-20 Maturity Price : 18.28 Evaluated at bid price : 18.28 Bid-YTW : 6.58 % |
| BMO.PR.W | FixedReset | -2.31 % | YTW SCENARIO Maturity Type : Limit Maturity Maturity Date : 2046-01-20 Maturity Price : 16.10 Evaluated at bid price : 16.10 Bid-YTW : 4.73 % |
| BAM.PR.N | Perpetual-Discount | -2.28 % | YTW SCENARIO Maturity Type : Limit Maturity Maturity Date : 2046-01-20 Maturity Price : 18.40 Evaluated at bid price : 18.40 Bid-YTW : 6.53 % |
| GWO.PR.S | Deemed-Retractible | -2.25 % | YTW SCENARIO Maturity Type : Hard Maturity Maturity Date : 2025-01-31 Maturity Price : 25.00 Evaluated at bid price : 22.54 Bid-YTW : 6.81 % |
| TD.PF.E | FixedReset | -2.25 % | YTW SCENARIO Maturity Type : Limit Maturity Maturity Date : 2046-01-20 Maturity Price : 17.40 Evaluated at bid price : 17.40 Bid-YTW : 5.05 % |
| GWO.PR.R | Deemed-Retractible | -2.24 % | YTW SCENARIO Maturity Type : Hard Maturity Maturity Date : 2025-01-31 Maturity Price : 25.00 Evaluated at bid price : 20.12 Bid-YTW : 7.96 % |
| GWO.PR.H | Deemed-Retractible | -2.21 % | YTW SCENARIO Maturity Type : Hard Maturity Maturity Date : 2025-01-31 Maturity Price : 25.00 Evaluated at bid price : 20.31 Bid-YTW : 7.88 % |
| IGM.PR.B | Perpetual-Premium | -2.20 % | YTW SCENARIO Maturity Type : Limit Maturity Maturity Date : 2046-01-20 Maturity Price : 23.58 Evaluated at bid price : 24.00 Bid-YTW : 6.16 % |
| BNS.PR.P | FixedReset | -2.19 % | YTW SCENARIO Maturity Type : Hard Maturity Maturity Date : 2022-01-31 Maturity Price : 25.00 Evaluated at bid price : 22.31 Bid-YTW : 5.00 % |
| GWO.PR.P | Deemed-Retractible | -2.18 % | YTW SCENARIO Maturity Type : Hard Maturity Maturity Date : 2025-01-31 Maturity Price : 25.00 Evaluated at bid price : 22.84 Bid-YTW : 6.78 % |
| TD.PF.F | Perpetual-Discount | -2.09 % | YTW SCENARIO Maturity Type : Limit Maturity Maturity Date : 2046-01-20 Maturity Price : 21.51 Evaluated at bid price : 21.51 Bid-YTW : 5.72 % |
| BAM.PF.B | FixedReset | -2.05 % | YTW SCENARIO Maturity Type : Limit Maturity Maturity Date : 2046-01-20 Maturity Price : 16.72 Evaluated at bid price : 16.72 Bid-YTW : 5.09 % |
| GWO.PR.I | Deemed-Retractible | -2.02 % | YTW SCENARIO Maturity Type : Hard Maturity Maturity Date : 2025-01-31 Maturity Price : 25.00 Evaluated at bid price : 19.37 Bid-YTW : 8.15 % |
| TD.PF.C | FixedReset | -2.00 % | YTW SCENARIO Maturity Type : Limit Maturity Maturity Date : 2046-01-20 Maturity Price : 16.20 Evaluated at bid price : 16.20 Bid-YTW : 4.67 % |
| FTS.PR.J | Perpetual-Discount | -1.97 % | YTW SCENARIO Maturity Type : Limit Maturity Maturity Date : 2046-01-20 Maturity Price : 19.86 Evaluated at bid price : 19.86 Bid-YTW : 6.08 % |
| FTS.PR.F | Perpetual-Discount | -1.90 % | YTW SCENARIO Maturity Type : Limit Maturity Maturity Date : 2046-01-20 Maturity Price : 20.64 Evaluated at bid price : 20.64 Bid-YTW : 6.04 % |
| BAM.PF.A | FixedReset | -1.89 % | YTW SCENARIO Maturity Type : Limit Maturity Maturity Date : 2046-01-20 Maturity Price : 17.63 Evaluated at bid price : 17.63 Bid-YTW : 5.18 % |
| BMO.PR.Q | FixedReset | -1.89 % | YTW SCENARIO Maturity Type : Hard Maturity Maturity Date : 2022-01-31 Maturity Price : 25.00 Evaluated at bid price : 18.20 Bid-YTW : 7.80 % |
| CCS.PR.C | Deemed-Retractible | -1.88 % | YTW SCENARIO Maturity Type : Hard Maturity Maturity Date : 2025-01-31 Maturity Price : 25.00 Evaluated at bid price : 20.36 Bid-YTW : 8.02 % |
| BAM.PF.D | Perpetual-Discount | -1.88 % | YTW SCENARIO Maturity Type : Limit Maturity Maturity Date : 2046-01-20 Maturity Price : 18.84 Evaluated at bid price : 18.84 Bid-YTW : 6.58 % |
| PWF.PR.P | FixedReset | -1.78 % | YTW SCENARIO Maturity Type : Limit Maturity Maturity Date : 2046-01-20 Maturity Price : 11.05 Evaluated at bid price : 11.05 Bid-YTW : 4.92 % |
| POW.PR.A | Perpetual-Discount | -1.78 % | YTW SCENARIO Maturity Type : Limit Maturity Maturity Date : 2046-01-20 Maturity Price : 22.95 Evaluated at bid price : 23.22 Bid-YTW : 6.07 % |
| RY.PR.I | FixedReset | -1.76 % | YTW SCENARIO Maturity Type : Hard Maturity Maturity Date : 2022-01-31 Maturity Price : 25.00 Evaluated at bid price : 21.75 Bid-YTW : 5.76 % |
| RY.PR.Z | FixedReset | -1.72 % | YTW SCENARIO Maturity Type : Limit Maturity Maturity Date : 2046-01-20 Maturity Price : 16.53 Evaluated at bid price : 16.53 Bid-YTW : 4.61 % |
| BMO.PR.S | FixedReset | -1.65 % | YTW SCENARIO Maturity Type : Limit Maturity Maturity Date : 2046-01-20 Maturity Price : 16.72 Evaluated at bid price : 16.72 Bid-YTW : 4.70 % |
| BAM.PF.E | FixedReset | -1.63 % | YTW SCENARIO Maturity Type : Limit Maturity Maturity Date : 2046-01-20 Maturity Price : 16.95 Evaluated at bid price : 16.95 Bid-YTW : 5.08 % |
| TD.PF.D | FixedReset | -1.61 % | YTW SCENARIO Maturity Type : Limit Maturity Maturity Date : 2046-01-20 Maturity Price : 17.10 Evaluated at bid price : 17.10 Bid-YTW : 5.01 % |
| MFC.PR.I | FixedReset | -1.61 % | YTW SCENARIO Maturity Type : Hard Maturity Maturity Date : 2025-01-31 Maturity Price : 25.00 Evaluated at bid price : 17.10 Bid-YTW : 8.90 % |
| BNS.PR.N | Deemed-Retractible | -1.61 % | YTW SCENARIO Maturity Type : Hard Maturity Maturity Date : 2022-01-31 Maturity Price : 25.00 Evaluated at bid price : 24.50 Bid-YTW : 5.65 % |
| TRP.PR.D | FixedReset | -1.59 % | YTW SCENARIO Maturity Type : Limit Maturity Maturity Date : 2046-01-20 Maturity Price : 14.85 Evaluated at bid price : 14.85 Bid-YTW : 5.31 % |
| RY.PR.L | FixedReset | -1.53 % | YTW SCENARIO Maturity Type : Hard Maturity Maturity Date : 2022-01-31 Maturity Price : 25.00 Evaluated at bid price : 23.87 Bid-YTW : 4.80 % |
| TRP.PR.E | FixedReset | -1.51 % | YTW SCENARIO Maturity Type : Limit Maturity Maturity Date : 2046-01-20 Maturity Price : 15.61 Evaluated at bid price : 15.61 Bid-YTW : 5.14 % |
| POW.PR.B | Perpetual-Discount | -1.51 % | YTW SCENARIO Maturity Type : Limit Maturity Maturity Date : 2046-01-20 Maturity Price : 21.97 Evaluated at bid price : 22.20 Bid-YTW : 6.06 % |
| MFC.PR.H | FixedReset | -1.49 % | YTW SCENARIO Maturity Type : Hard Maturity Maturity Date : 2025-01-31 Maturity Price : 25.00 Evaluated at bid price : 17.89 Bid-YTW : 8.50 % |
| RY.PR.P | Perpetual-Discount | -1.48 % | YTW SCENARIO Maturity Type : Limit Maturity Maturity Date : 2046-01-20 Maturity Price : 22.92 Evaluated at bid price : 23.30 Bid-YTW : 5.77 % |
| RY.PR.K | FloatingReset | -1.47 % | YTW SCENARIO Maturity Type : Hard Maturity Maturity Date : 2022-01-31 Maturity Price : 25.00 Evaluated at bid price : 20.84 Bid-YTW : 5.55 % |
| MFC.PR.G | FixedReset | -1.46 % | YTW SCENARIO Maturity Type : Hard Maturity Maturity Date : 2025-01-31 Maturity Price : 25.00 Evaluated at bid price : 16.85 Bid-YTW : 9.02 % |
| TRP.PR.G | FixedReset | -1.45 % | YTW SCENARIO Maturity Type : Limit Maturity Maturity Date : 2046-01-20 Maturity Price : 16.95 Evaluated at bid price : 16.95 Bid-YTW : 5.39 % |
| CIU.PR.A | Perpetual-Discount | -1.44 % | YTW SCENARIO Maturity Type : Limit Maturity Maturity Date : 2046-01-20 Maturity Price : 19.14 Evaluated at bid price : 19.14 Bid-YTW : 6.11 % |
| NA.PR.Q | FixedReset | -1.44 % | YTW SCENARIO Maturity Type : Hard Maturity Maturity Date : 2022-01-31 Maturity Price : 25.00 Evaluated at bid price : 21.25 Bid-YTW : 6.25 % |
| POW.PR.G | Perpetual-Discount | -1.43 % | YTW SCENARIO Maturity Type : Limit Maturity Maturity Date : 2046-01-20 Maturity Price : 22.96 Evaluated at bid price : 23.36 Bid-YTW : 6.02 % |
| TD.PR.Z | FloatingReset | -1.43 % | YTW SCENARIO Maturity Type : Hard Maturity Maturity Date : 2022-01-31 Maturity Price : 25.00 Evaluated at bid price : 21.35 Bid-YTW : 4.73 % |
| BNS.PR.Q | FixedReset | -1.39 % | YTW SCENARIO Maturity Type : Hard Maturity Maturity Date : 2022-01-31 Maturity Price : 25.00 Evaluated at bid price : 21.98 Bid-YTW : 5.29 % |
| W.PR.K | FixedReset | -1.38 % | YTW SCENARIO Maturity Type : Limit Maturity Maturity Date : 2046-01-20 Maturity Price : 22.57 Evaluated at bid price : 23.55 Bid-YTW : 5.59 % |
| ELF.PR.H | Perpetual-Discount | -1.34 % | YTW SCENARIO Maturity Type : Limit Maturity Maturity Date : 2046-01-20 Maturity Price : 21.80 Evaluated at bid price : 22.10 Bid-YTW : 6.26 % |
| ELF.PR.G | Perpetual-Discount | -1.30 % | YTW SCENARIO Maturity Type : Limit Maturity Maturity Date : 2046-01-20 Maturity Price : 19.78 Evaluated at bid price : 19.78 Bid-YTW : 6.05 % |
| BMO.PR.T | FixedReset | -1.27 % | YTW SCENARIO Maturity Type : Limit Maturity Maturity Date : 2046-01-20 Maturity Price : 16.35 Evaluated at bid price : 16.35 Bid-YTW : 4.69 % |
| CM.PR.P | FixedReset | -1.25 % | YTW SCENARIO Maturity Type : Limit Maturity Maturity Date : 2046-01-20 Maturity Price : 15.85 Evaluated at bid price : 15.85 Bid-YTW : 4.78 % |
| NA.PR.S | FixedReset | -1.23 % | YTW SCENARIO Maturity Type : Limit Maturity Maturity Date : 2046-01-20 Maturity Price : 16.00 Evaluated at bid price : 16.00 Bid-YTW : 4.96 % |
| RY.PR.N | Perpetual-Discount | -1.22 % | YTW SCENARIO Maturity Type : Limit Maturity Maturity Date : 2046-01-20 Maturity Price : 21.58 Evaluated at bid price : 21.90 Bid-YTW : 5.67 % |
| RY.PR.W | Perpetual-Discount | -1.21 % | YTW SCENARIO Maturity Type : Limit Maturity Maturity Date : 2046-01-20 Maturity Price : 21.76 Evaluated at bid price : 22.01 Bid-YTW : 5.65 % |
| BNS.PR.Y | FixedReset | -1.21 % | YTW SCENARIO Maturity Type : Hard Maturity Maturity Date : 2022-01-31 Maturity Price : 25.00 Evaluated at bid price : 18.77 Bid-YTW : 6.87 % |
| BNS.PR.R | FixedReset | -1.19 % | YTW SCENARIO Maturity Type : Hard Maturity Maturity Date : 2022-01-31 Maturity Price : 25.00 Evaluated at bid price : 22.45 Bid-YTW : 5.17 % |
| GWO.PR.F | Deemed-Retractible | -1.16 % | YTW SCENARIO Maturity Type : Hard Maturity Maturity Date : 2025-01-31 Maturity Price : 25.00 Evaluated at bid price : 24.75 Bid-YTW : 6.14 % |
| BNS.PR.A | FloatingReset | -1.13 % | YTW SCENARIO Maturity Type : Hard Maturity Maturity Date : 2022-01-31 Maturity Price : 25.00 Evaluated at bid price : 21.91 Bid-YTW : 4.65 % |
| GWO.PR.L | Deemed-Retractible | -1.13 % | YTW SCENARIO Maturity Type : Hard Maturity Maturity Date : 2025-01-31 Maturity Price : 25.00 Evaluated at bid price : 23.69 Bid-YTW : 6.52 % |
| RY.PR.C | Deemed-Retractible | -1.12 % | YTW SCENARIO Maturity Type : Hard Maturity Maturity Date : 2022-01-31 Maturity Price : 25.00 Evaluated at bid price : 23.91 Bid-YTW : 5.64 % |
| RY.PR.B | Deemed-Retractible | -1.12 % | YTW SCENARIO Maturity Type : Hard Maturity Maturity Date : 2022-01-31 Maturity Price : 25.00 Evaluated at bid price : 23.92 Bid-YTW : 5.73 % |
| RY.PR.G | Deemed-Retractible | -1.08 % | YTW SCENARIO Maturity Type : Hard Maturity Maturity Date : 2022-01-31 Maturity Price : 25.00 Evaluated at bid price : 23.83 Bid-YTW : 5.59 % |
| BNS.PR.L | Deemed-Retractible | -1.05 % | YTW SCENARIO Maturity Type : Hard Maturity Maturity Date : 2022-01-31 Maturity Price : 25.00 Evaluated at bid price : 23.50 Bid-YTW : 5.69 % |
| GWO.PR.Q | Deemed-Retractible | -1.04 % | YTW SCENARIO Maturity Type : Hard Maturity Maturity Date : 2025-01-31 Maturity Price : 25.00 Evaluated at bid price : 21.80 Bid-YTW : 7.19 % |
| PVS.PR.E | SplitShare | 1.08 % | YTW SCENARIO Maturity Type : Hard Maturity Maturity Date : 2022-10-31 Maturity Price : 25.00 Evaluated at bid price : 23.45 Bid-YTW : 6.83 % |
| BAM.PR.B | Floater | 1.38 % | YTW SCENARIO Maturity Type : Limit Maturity Maturity Date : 2046-01-20 Maturity Price : 9.56 Evaluated at bid price : 9.56 Bid-YTW : 4.99 % |
| BAM.PR.Z | FixedReset | 1.92 % | YTW SCENARIO Maturity Type : Limit Maturity Maturity Date : 2046-01-20 Maturity Price : 17.56 Evaluated at bid price : 17.56 Bid-YTW : 5.27 % |
| PWF.PR.A | Floater | 11.70 % | YTW SCENARIO Maturity Type : Limit Maturity Maturity Date : 2046-01-20 Maturity Price : 11.17 Evaluated at bid price : 11.17 Bid-YTW : 4.28 % |
| Volume Highlights | |||
| Issue | Index | Shares Traded |
Notes |
| BNS.PR.E | FixedReset | 171,178 | TD crossed blocks of 50,000 shares, 30,000 and 10,900, all at 25.32, and another 30,000 at 25.30. CIBC sold 10,000 to anonymous at 25.28. YTW SCENARIO Maturity Type : Limit Maturity Maturity Date : 2046-01-20 Maturity Price : 23.22 Evaluated at bid price : 25.22 Bid-YTW : 5.10 % |
| TD.PF.G | FixedReset | 154,883 | Recent new issue. YTW SCENARIO Maturity Type : Limit Maturity Maturity Date : 2046-01-20 Maturity Price : 23.21 Evaluated at bid price : 25.20 Bid-YTW : 5.19 % |
| BMO.PR.S | FixedReset | 98,794 | Scotia crossed 25,000 at 16.99ll Nesbitt crossed 40,000 at 17.10. YTW SCENARIO Maturity Type : Limit Maturity Maturity Date : 2046-01-20 Maturity Price : 16.72 Evaluated at bid price : 16.72 Bid-YTW : 4.70 % |
| RY.PR.Q | FixedReset | 98,273 | Scotia crossed 30,000 at 25.27. YTW SCENARIO Maturity Type : Limit Maturity Maturity Date : 2046-01-20 Maturity Price : 23.21 Evaluated at bid price : 25.20 Bid-YTW : 5.12 % |
| BAM.PR.R | FixedReset | 88,196 | TD crossed 10,000 at 13.25. YTW SCENARIO Maturity Type : Limit Maturity Maturity Date : 2046-01-20 Maturity Price : 13.05 Evaluated at bid price : 13.05 Bid-YTW : 5.62 % |
| CM.PR.O | FixedReset | 76,650 | RBC crossed 50,000 at 16.50. YTW SCENARIO Maturity Type : Limit Maturity Maturity Date : 2046-01-20 Maturity Price : 16.36 Evaluated at bid price : 16.36 Bid-YTW : 4.74 % |
| There were 73 other index-included issues trading in excess of 10,000 shares. | |||
| Wide Spread Highlights | ||
| Issue | Index | Quote Data and Yield Notes |
| BAM.PR.E | Ratchet | Quote: 10.95 – 12.91 Spot Rate : 1.9600 Average : 1.2705 YTW SCENARIO |
| BAM.PR.K | Floater | Quote: 8.60 – 9.80 Spot Rate : 1.2000 Average : 0.7410 YTW SCENARIO |
| SLF.PR.J | FloatingReset | Quote: 10.58 – 11.75 Spot Rate : 1.1700 Average : 0.7778 YTW SCENARIO |
| FTS.PR.M | FixedReset | Quote: 16.00 – 17.00 Spot Rate : 1.0000 Average : 0.6606 YTW SCENARIO |
| FTS.PR.H | FixedReset | Quote: 11.28 – 12.10 Spot Rate : 0.8200 Average : 0.5306 YTW SCENARIO |
| TD.PF.E | FixedReset | Quote: 17.40 – 18.40 Spot Rate : 1.0000 Average : 0.7500 YTW SCENARIO |