The Bank of Canada has released the proceedins of its “Festschrift in Honour of David Dodge’s Contributions to Canadian Public Policy”.
Sessions reported are:
- The Financial Crisis and the Policy Responses : An Empirical Analysis of What Went Wrong
- Whither Financial Regulation?
- Inflation Targeting
- Fiscal Priorities for Canada: Building on the Legacy of David Dodge
- The Paradox of Market-Oriented Public Policy and Poor Productivity Growth in Canada
- Canada’s Aging Workforce: Participation, Productivity, and Living Standards
- Economic Change and Worker Displacement in Canada: Consequences and Policy Responses
The first session, by John Taylor of Taylor Rule fame, discusses the causes of the crisis. He repeats his thesis, mentioned on PrefBlog on Feb. 6, 2008 and discussed on Econbrowser in its post The Taylor Rule and the Housing Boom:
The classic explanation of financial crises, going back hundreds of years, is that they are caused by excesses—frequently monetary excesses—which lead to a boom and an inevitable bust. In the recent crisis, we had a housing boom and bust, which in turn led to financial turmoil in the United States and other countries. I begin by showing that monetary excesses were the main cause of that boom and the resulting bust.
What? It wasn’t simply greedy, stupid, over-bonused bankers who caused the crisis? Prof. Taylor is actually suggesting that regulators might have something to do with it? Such heresy!
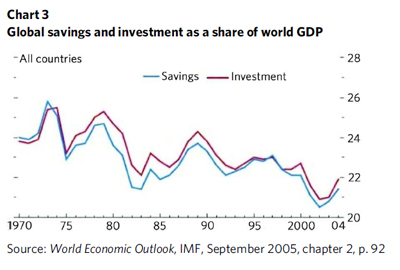
Taylor is dismissive of the ‘global savings glut’ theory:
This alternative explanation focuses on global savings. It argues that there was an excess of world savings—a global savings glut—which pushed interest rates down in the United States and other countries.
…
The main problem with this explanation is that there is no evidence for a global savings glut. On the contrary, as Chart 3 shows in very simple terms, there seems to be a savings shortage.
But don’t blame it all on Greenspan, he had lots of helpers:
Nevertheless, there are possible global connections to keep track of when assessing the root cause of the crisis. Most important is the evidence that interest rates at several other central banks also deviated from what historical regularities, as described by a Taylor rule, would predict. Even more striking is that housing booms were largest where the deviations from the rule were largest.
Naturally, there are complicating factors:
A sharp boom and bust in the housing markets would be expected to have had impacts on the financial markets as falling house prices led to delinquencies and foreclosures. These effects were amplified by several complicating factors, including the use of subprime mortgages, especially the adjustable-rate variety, which led to excessive risk taking. In the United States, this was encouraged by government programs designed to promote home
ownership—a worthwhile goal but, in retrospect, overdone.
It is important to note, however, that the excessive risk taking and the low-interest monetary
policy decisions are connected.
Sub-prime, in and of itself, is merely an amplifying factor:
A significant amplification of these problems occurred because the adjustable-rate subprime and other mortgages were packed into mortgage-backed securities of great complexity. The risk was underestimated by the rating agencies either because of a lack of competition, poor accountability or, most likely, an inherent difficulty in assessing risk owing to the complexity.
…
In the United States, other government actions were at play. The government-sponsored agencies Fannie Mae and Freddie Mac were encouraged to expand and buy mortgagebacked securities, including those formed with the risky subprime mortgages. While legislation such as the Federal Housing Enterprise Regulatory Reform Act of 2005 was proposed to control these excesses, it was not passed into law. The actions of these agencies should be added to the list of government interventions that were part of the problem.
The crisis was prolonged due to counterparty risk:
In autumn 2007, John Williams and I embarked on what we thought would be an interesting and possibly policy-relevant research project [3] to examine the issue. We interviewed traders who deal in the interbank market and we looked for measures of counterparty risk. The idea that counterparty risk was the reason for the increased spreads made sense, because it corresponded to the queen of spades theory and other reasons for uncertainty about banks’ balance sheets. At the time, however, many traders and monetary officials thought it was mainly a liquidity problem.
…
The results are illustrated in Chart 8, which shows the high correlation between the unsecured/secured spread and the LIBOR-OIS spread. There seemed to be little role for liquidity. These results suggested, therefore, that the market turmoil in the interbank market was not a liquidity problem of the kind that could be alleviated simply by central bank liquidity tools. Rather, it was inherently an issue of counterparty risk, which linked back to the underlying cause of the financial crisis. This was not a situation like the Great Depression, where simply printing money or providing liquidity was the solution; rather, it was due to fundamental problems in the financial sector relating to risk.
And then, he claims, regulatory actions either did not help or made things worse:
As evidence, I provide three specific examples of the interventions that prolonged the
crisis, either because they did not address the problem or because they had unintended
consequences.
…
Term Auction Facility
…
Temporary cash infusions
…
The initial cuts in interest rates through April 2008
… and he claims that the increase in severity in fall 2008 was more complicated than “Lehman”:
The main message of Chart 13 is that identifying the decisions over the weekend of 13 and 14 September as the cause of the increased severity of the crisis is questionable. It was not until more than a week later that conditions deteriorated. Moreover, it is plausible that events around 23 September actually drove the market, including the realization by the public that the intervention plan had not been fully thought through and that conditions were much worse than many had been led to believe. At a minimum, a great deal of uncertainty about what the government would do to aid financial institutions, and under what circumstances, was revealed and thereby added to business and investment decisions at that time. Such uncertainty would have driven up risk spreads in the interbank market and elsewhere.
Dr. Taylor concludes:
In this paper, I have provided empirical evidence that government actions and interventions caused, prolonged, and worsened the financial crisis. They caused it by deviating from historical precedents and principles for setting interest rates, which had worked well for 20 years. They prolonged it by misdiagnosing the problems in the bank credit markets and thereby responding inappropriately by focusing on liquidity rather than risk. They made it worse by providing support for certain financial institutions and their creditors but not for others in an ad hoc fashion without a clear and understandable framework. While other factors were certainly at play, these government actions should be first on the list of answers to the question of what went wrong.