OSFI is busily cementing its reputation as a bastion of political expediency:
The Office of the Superintendent of Financial Institutions, or OSFI, Canada’s banking regulator, plans to delve into the way that pay packages are designed at a variety of levels throughout banks. The goal is to prevent excessive risk taking by bankers in search of big bonuses, a behaviour that has been fingered as a key contributor to the U.S. banking meltdown.
What a complete joke. OSFI is incapable of running the simplest of simulations – they were astonished that underprovisioning for explected losses had an effect on the Assets-to-Capital multiple calculation, despite years of testing beforehand – and now they’re going to micro-manage bonuses; well, it gets headlines, anyway, and extends the bureaucratic empire.
CEBS is running a consultation process on the topic (the public meeting should be a hoot!), but OSFI already knows everything, so can’t be bothered.
This micro-management will result in the continued growth of hedge funds and the shadow-banking sector (almost certainly outside Canada) and, while it may prevent the occasional small collapse, will end up the same way every other politically inspired feel-goodism project ends up: a lot of money for well-connected consultants, no effect on those who make hiring decisions regarding how many ex-regulators need to be hired to sit on the compensation committee, further stifling of creativity … and a much larger eventual collapse when the chickens finally come home to roost. As they will, since the regulatory capture inherent in micromanagement means that small errors will be papered over with rule changes, interpretations and exemptions until they become … large errors.
However, this will come after the next election, so who cares? Bonus control is simply a method of grandstanding.
Paul Volcker has made some remarks interpreted as nostalgia for Glass-Steagall:
“Maybe we ought to have a kind of two-tier financial system,” Volcker, who heads President Barack Obama’s Economic Recovery Advisory Board, said today at a conference at New York University’s Stern School of Business.
Commercial banks would provide customers with depository services and access to credit and would be highly regulated, while securities firms would have the freedom to take on more risk and practice trading, “relatively free of regulation,” Volcker said.
Volcker’s remarks indicated his preference for reinstating some of the divisions between commercial and investment banks that were removed by Congress’s repeal in 1999 of the Great Depression-era Glass-Steagall Act.
Volcker’s proposals, included in a January report he wrote with the Group of 30, would allow commercial banks to continue to do underwriting and provide merger advice, activities traditionally associated with investment banking, he said.
I couldn’t agree more; I have argued for some time that what we really need is a three-tier financial system, with a rock-solid banking core surrounded by a layer of investment banks and brokerages, surrounded in turn by a wild-n-wooly world of hedge-funds and shadow banks.
I would not support legislating the differences. I will support a regulatory regime that offers a choice between business models: traditional banking or traditional investment banking. The former (core) model would focus on long-term lending and impose a high capital charge for trading and investment operations; the latter model would impose capital charge penalties for long-term positions.
Bankers can’t trade. Bankers can barely manage to bank!
Another cruddy day for equities, particularly insurers:
Canadian stocks fell to a five-year low as the highest U.S. unemployment rate in a quarter century reinforced concern that the global recession will hurt profits and deplete financial companies’ capital.
…
Manulife, the country’s biggest insurance company, dropped 3.5 percent to C$9.65, the lowest intraday price since March 2000. The stock fell 25 percent this week.Sun Life, Canada’s third-largest insurer, fell 2.7 percent to C$15.68 after it had its credit rating cut to A+ from AA- by S&P, which said declining stock and bond prices may reduce earnings. Great-West Lifeco Inc., the nation’s second-biggest insurer, fell 6.7 percent to C$12.12, the lowest since May 2000.
Canadian insurance stocks have fallen 46 percent this year on speculation that losses on securities will force them to sell stock or cut dividends to bolster capital. Wells Fargo, the fourth-largest U.S. bank, cut its quarterly dividend by 85 percent in a move to save $5 billion a year.
And preferreds were not immune…
| HIMIPref™ Preferred Indices These values reflect the December 2008 revision of the HIMIPref™ Indices Values are provisional and are finalized monthly |
|||||||
| Index | Mean Current Yield (at bid) |
Median YTW |
Median Average Trading Value |
Median Mod Dur (YTW) |
Issues | Day’s Perf. | Index Value |
| Ratchet | 0.00 % | 0.00 % | 0 | 0.00 | 0 | -2.5594 % | 791.7 |
| FixedFloater | 0.00 % | 0.00 % | 0 | 0.00 | 0 | -2.5594 % | 1,280.4 |
| Floater | 4.92 % | 6.37 % | 65,178 | 13.26 | 3 | -2.5594 % | 989.1 |
| OpRet | 5.29 % | 5.15 % | 146,952 | 3.92 | 15 | 0.5838 % | 2,038.3 |
| SplitShare | 6.98 % | 9.27 % | 55,250 | 4.83 | 6 | 0.0625 % | 1,589.8 |
| Interest-Bearing | 6.42 % | 16.00 % | 39,056 | 0.77 | 1 | -3.2091 % | 1,829.8 |
| Perpetual-Premium | 0.00 % | 0.00 % | 0 | 0.00 | 0 | -0.6842 % | 1,440.8 |
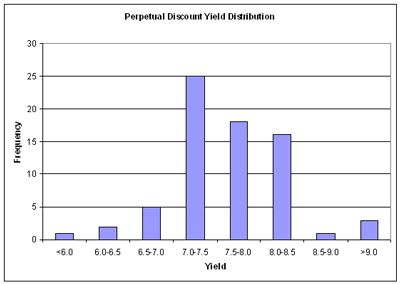
| Perpetual-Discount | 7.49 % | 7.49 % | 170,162 | 11.90 | 71 | -0.6842 % | 1,327.0 |
| FixedReset | 6.22 % | 5.95 % | 495,796 | 13.66 | 30 | -0.2536 % | 1,779.9 |
| Performance Highlights | |||
| Issue | Index | Change | Notes |
| PWF.PR.K | Perpetual-Discount | -6.86 % | Not as bad as it looks, but still pretty bad! Traded 13,891 shares in a range of 14.75-30 before the bids ran out and it closed at 14.25-80, 2×1. YTW SCENARIO Maturity Type : Limit Maturity Maturity Date : 2039-03-06 Maturity Price : 14.25 Evaluated at bid price : 14.25 Bid-YTW : 8.86 % |
| SLF.PR.B | Perpetual-Discount | -6.51 % | Crunch! Traded 16,397 shares in a range of 14.00-74 before closing at 13.79-00, 2×2. YTW SCENARIO Maturity Type : Limit Maturity Maturity Date : 2039-03-06 Maturity Price : 13.79 Evaluated at bid price : 13.79 Bid-YTW : 8.74 % |
| BAM.PR.B | Floater | -5.48 % | Traded 7,424 shares in a range of 6.99-30 before closing at 6.90-00, 10×26. YTW SCENARIO Maturity Type : Limit Maturity Maturity Date : 2039-03-06 Maturity Price : 6.90 Evaluated at bid price : 6.90 Bid-YTW : 6.47 % |
| GWO.PR.H | Perpetual-Discount | -5.13 % | At least this one managed to catch a bid towards the end! Traded 4,200 shares in a range of 14.73-50 before closing at 14.80-37, 11×2. YTW SCENARIO Maturity Type : Limit Maturity Maturity Date : 2039-03-06 Maturity Price : 14.80 Evaluated at bid price : 14.80 Bid-YTW : 8.22 % |
| TD.PR.Y | FixedReset | -4.91 % | YTW SCENARIO Maturity Type : Limit Maturity Maturity Date : 2039-03-06 Maturity Price : 20.16 Evaluated at bid price : 20.16 Bid-YTW : 4.88 % |
| SLF.PR.C | Perpetual-Discount | -4.21 % | YTW SCENARIO Maturity Type : Limit Maturity Maturity Date : 2039-03-06 Maturity Price : 13.20 Evaluated at bid price : 13.20 Bid-YTW : 8.46 % |
| BAM.PR.K | Floater | -4.11 % | YTW SCENARIO Maturity Type : Limit Maturity Maturity Date : 2039-03-06 Maturity Price : 7.00 Evaluated at bid price : 7.00 Bid-YTW : 6.37 % |
| GWO.PR.I | Perpetual-Discount | -3.87 % | YTW SCENARIO Maturity Type : Limit Maturity Maturity Date : 2039-03-06 Maturity Price : 14.41 Evaluated at bid price : 14.41 Bid-YTW : 7.84 % |
| LFE.PR.A | SplitShare | -3.58 % | Asset coverage of 1.0+:1 as of February 27, according to the company. YTW SCENARIO Maturity Type : Hard Maturity Maturity Date : 2012-12-01 Maturity Price : 10.00 Evaluated at bid price : 5.93 Bid-YTW : 21.97 % |
| SLF.PR.A | Perpetual-Discount | -3.55 % | YTW SCENARIO Maturity Type : Limit Maturity Maturity Date : 2039-03-06 Maturity Price : 13.60 Evaluated at bid price : 13.60 Bid-YTW : 8.77 % |
| SLF.PR.E | Perpetual-Discount | -3.31 % | YTW SCENARIO Maturity Type : Limit Maturity Maturity Date : 2039-03-06 Maturity Price : 13.15 Evaluated at bid price : 13.15 Bid-YTW : 8.59 % |
| MFC.PR.B | Perpetual-Discount | -3.23 % | YTW SCENARIO Maturity Type : Limit Maturity Maturity Date : 2039-03-06 Maturity Price : 15.00 Evaluated at bid price : 15.00 Bid-YTW : 7.80 % |
| STW.PR.A | Interest-Bearing | -3.21 % | Asset coverage of 1.5-:1 as of Feb. 26 based on Capital Units at 2.37 and 1.98 Capital Units per Preferred. YTW SCENARIO Maturity Type : Hard Maturity Maturity Date : 2009-12-31 Maturity Price : 10.00 Evaluated at bid price : 9.35 Bid-YTW : 16.00 % |
| GWO.PR.G | Perpetual-Discount | -3.07 % | YTW SCENARIO Maturity Type : Limit Maturity Maturity Date : 2039-03-06 Maturity Price : 15.77 Evaluated at bid price : 15.77 Bid-YTW : 8.28 % |
| PWF.PR.F | Perpetual-Discount | -2.94 % | YTW SCENARIO Maturity Type : Limit Maturity Maturity Date : 2039-03-06 Maturity Price : 15.85 Evaluated at bid price : 15.85 Bid-YTW : 8.44 % |
| POW.PR.A | Perpetual-Discount | -2.75 % | YTW SCENARIO Maturity Type : Limit Maturity Maturity Date : 2039-03-06 Maturity Price : 17.30 Evaluated at bid price : 17.30 Bid-YTW : 8.28 % |
| GWO.PR.J | FixedReset | -2.54 % | YTW SCENARIO Maturity Type : Limit Maturity Maturity Date : 2039-03-06 Maturity Price : 23.37 Evaluated at bid price : 23.41 Bid-YTW : 5.53 % |
| PWF.PR.I | Perpetual-Discount | -2.38 % | YTW SCENARIO Maturity Type : Limit Maturity Maturity Date : 2039-03-06 Maturity Price : 19.25 Evaluated at bid price : 19.25 Bid-YTW : 7.93 % |
| PWF.PR.H | Perpetual-Discount | -1.93 % | YTW SCENARIO Maturity Type : Limit Maturity Maturity Date : 2039-03-06 Maturity Price : 17.80 Evaluated at bid price : 17.80 Bid-YTW : 8.23 % |
| SLF.PR.D | Perpetual-Discount | -1.89 % | YTW SCENARIO Maturity Type : Limit Maturity Maturity Date : 2039-03-06 Maturity Price : 13.01 Evaluated at bid price : 13.01 Bid-YTW : 8.59 % |
| TD.PR.O | Perpetual-Discount | -1.85 % | YTW SCENARIO Maturity Type : Limit Maturity Maturity Date : 2039-03-06 Maturity Price : 17.52 Evaluated at bid price : 17.52 Bid-YTW : 7.03 % |
| BNS.PR.M | Perpetual-Discount | -1.72 % | YTW SCENARIO Maturity Type : Limit Maturity Maturity Date : 2039-03-06 Maturity Price : 16.03 Evaluated at bid price : 16.03 Bid-YTW : 7.14 % |
| HSB.PR.C | Perpetual-Discount | -1.69 % | YTW SCENARIO Maturity Type : Limit Maturity Maturity Date : 2039-03-06 Maturity Price : 17.45 Evaluated at bid price : 17.45 Bid-YTW : 7.49 % |
| PWF.PR.L | Perpetual-Discount | -1.58 % | YTW SCENARIO Maturity Type : Limit Maturity Maturity Date : 2039-03-06 Maturity Price : 15.60 Evaluated at bid price : 15.60 Bid-YTW : 8.33 % |
| SBN.PR.A | SplitShare | -1.54 % | Asset coverage of 1.6-:1 as of February 28, according to Mulvihill. YTW SCENARIO Maturity Type : Hard Maturity Maturity Date : 2014-12-01 Maturity Price : 10.00 Evaluated at bid price : 8.29 Bid-YTW : 9.27 % |
| MFC.PR.C | Perpetual-Discount | -1.46 % | YTW SCENARIO Maturity Type : Limit Maturity Maturity Date : 2039-03-06 Maturity Price : 14.13 Evaluated at bid price : 14.13 Bid-YTW : 8.01 % |
| IAG.PR.A | Perpetual-Discount | -1.45 % | YTW SCENARIO Maturity Type : Limit Maturity Maturity Date : 2039-03-06 Maturity Price : 14.25 Evaluated at bid price : 14.25 Bid-YTW : 8.10 % |
| TD.PR.R | Perpetual-Discount | -1.45 % | YTW SCENARIO Maturity Type : Limit Maturity Maturity Date : 2039-03-06 Maturity Price : 19.72 Evaluated at bid price : 19.72 Bid-YTW : 7.22 % |
| POW.PR.C | Perpetual-Discount | -1.42 % | YTW SCENARIO Maturity Type : Limit Maturity Maturity Date : 2039-03-06 Maturity Price : 18.00 Evaluated at bid price : 18.00 Bid-YTW : 8.24 % |
| TD.PR.S | FixedReset | -1.33 % | YTW SCENARIO Maturity Type : Limit Maturity Maturity Date : 2039-03-06 Maturity Price : 20.00 Evaluated at bid price : 20.00 Bid-YTW : 4.78 % |
| BNS.PR.N | Perpetual-Discount | -1.32 % | YTW SCENARIO Maturity Type : Limit Maturity Maturity Date : 2039-03-06 Maturity Price : 18.70 Evaluated at bid price : 18.70 Bid-YTW : 7.14 % |
| BNS.PR.R | FixedReset | -1.19 % | YTW SCENARIO Maturity Type : Limit Maturity Maturity Date : 2039-03-06 Maturity Price : 20.75 Evaluated at bid price : 20.75 Bid-YTW : 4.92 % |
| NA.PR.N | FixedReset | -1.07 % | YTW SCENARIO Maturity Type : Limit Maturity Maturity Date : 2039-03-06 Maturity Price : 22.21 Evaluated at bid price : 22.27 Bid-YTW : 4.77 % |
| GWO.PR.F | Perpetual-Discount | -1.00 % | YTW SCENARIO Maturity Type : Limit Maturity Maturity Date : 2039-03-06 Maturity Price : 19.80 Evaluated at bid price : 19.80 Bid-YTW : 7.47 % |
| CM.PR.H | Perpetual-Discount | 1.03 % | YTW SCENARIO Maturity Type : Limit Maturity Maturity Date : 2039-03-06 Maturity Price : 15.75 Evaluated at bid price : 15.75 Bid-YTW : 7.76 % |
| ENB.PR.A | Perpetual-Discount | 1.05 % | YTW SCENARIO Maturity Type : Limit Maturity Maturity Date : 2039-03-06 Maturity Price : 22.88 Evaluated at bid price : 23.15 Bid-YTW : 5.97 % |
| RY.PR.H | Perpetual-Discount | 1.13 % | YTW SCENARIO Maturity Type : Limit Maturity Maturity Date : 2039-03-06 Maturity Price : 20.60 Evaluated at bid price : 20.60 Bid-YTW : 6.94 % |
| TD.PR.A | FixedReset | 1.14 % | YTW SCENARIO Maturity Type : Limit Maturity Maturity Date : 2039-03-06 Maturity Price : 22.21 Evaluated at bid price : 22.25 Bid-YTW : 4.63 % |
| RY.PR.I | FixedReset | 1.14 % | YTW SCENARIO Maturity Type : Limit Maturity Maturity Date : 2039-03-06 Maturity Price : 22.21 Evaluated at bid price : 22.25 Bid-YTW : 4.59 % |
| BMO.PR.H | Perpetual-Discount | 1.30 % | YTW SCENARIO Maturity Type : Limit Maturity Maturity Date : 2039-03-06 Maturity Price : 18.72 Evaluated at bid price : 18.72 Bid-YTW : 7.16 % |
| NA.PR.K | Perpetual-Discount | 1.36 % | YTW SCENARIO Maturity Type : Limit Maturity Maturity Date : 2039-03-06 Maturity Price : 19.37 Evaluated at bid price : 19.37 Bid-YTW : 7.66 % |
| CM.PR.D | Perpetual-Discount | 1.49 % | YTW SCENARIO Maturity Type : Limit Maturity Maturity Date : 2039-03-06 Maturity Price : 19.03 Evaluated at bid price : 19.03 Bid-YTW : 7.69 % |
| BMO.PR.K | Perpetual-Discount | 2.00 % | YTW SCENARIO Maturity Type : Limit Maturity Maturity Date : 2039-03-06 Maturity Price : 17.35 Evaluated at bid price : 17.35 Bid-YTW : 7.66 % |
| IAG.PR.C | FixedReset | 2.38 % | YTW SCENARIO Maturity Type : Limit Maturity Maturity Date : 2039-03-06 Maturity Price : 21.50 Evaluated at bid price : 21.50 Bid-YTW : 6.38 % |
| BNA.PR.A | SplitShare | 3.27 % | Asset coverage of 1.7-:1 as of February 28 according to the company. YTW SCENARIO Maturity Type : Hard Maturity Maturity Date : 2010-09-30 Maturity Price : 25.00 Evaluated at bid price : 23.70 Bid-YTW : 9.97 % |
| ELF.PR.F | Perpetual-Discount | 4.88 % | YTW SCENARIO Maturity Type : Limit Maturity Maturity Date : 2039-03-06 Maturity Price : 14.84 Evaluated at bid price : 14.84 Bid-YTW : 9.15 % |
| BAM.PR.J | OpRet | 8.04 % | YTW SCENARIO Maturity Type : Soft Maturity Maturity Date : 2018-03-30 Maturity Price : 25.00 Evaluated at bid price : 18.40 Bid-YTW : 10.16 % |
| Volume Highlights | |||
| Issue | Index | Shares Traded |
Notes |
| TD.PR.I | FixedReset | 452,475 | New issue settled today. YTW SCENARIO Maturity Type : Limit Maturity Maturity Date : 2039-03-06 Maturity Price : 23.08 Evaluated at bid price : 24.85 Bid-YTW : 6.04 % |
| CM.PR.M | FixedReset | 262,889 | New issue settled today. YTW SCENARIO Maturity Type : Limit Maturity Maturity Date : 2039-03-06 Maturity Price : 23.00 Evaluated at bid price : 24.62 Bid-YTW : 6.31 % |
| MFC.PR.D | FixedReset | 254,196 | Recent new issue. YTW SCENARIO Maturity Type : Limit Maturity Maturity Date : 2039-03-06 Maturity Price : 24.06 Evaluated at bid price : 24.10 Bid-YTW : 6.73 % |
| CM.PR.A | OpRet | 101,350 | TD bought 22,500 from Nesbitt at 25.75 and 15,900 from CIBC at the same price. YTW SCENARIO Maturity Type : Call Maturity Date : 2009-04-05 Maturity Price : 25.50 Evaluated at bid price : 25.75 Bid-YTW : -0.33 % |
| RY.PR.R | FixedReset | 66,182 | YTW SCENARIO Maturity Type : Call Maturity Date : 2014-03-26 Maturity Price : 25.00 Evaluated at bid price : 25.29 Bid-YTW : 6.17 % |
| HSB.PR.D | Perpetual-Discount | 48,933 | Nesbitt crossed 39,400 at 16.75. YTW SCENARIO Maturity Type : Limit Maturity Maturity Date : 2039-03-06 Maturity Price : 16.75 Evaluated at bid price : 16.75 Bid-YTW : 7.65 % |
| There were 26 other index-included issues trading in excess of 10,000 shares. | |||