There is speculation that negative interest rates are nothing special:
Now that Sweden and Switzerland have shown that negative benchmark interest rates don’t necessarily result in flights to cash, asset bubbles or banking strains, the global giants of central banking may be more willing to embrace sub-zero borrowing costs the next time their economies slide.
…
European Central Bank President Mario Draghi is open to reducing the rate he charges banks to leave money in his coffers overnight further into negative territory. Bank of England Governor Mark Carney has also revised his thinking to say the U.K. benchmark could fall below 0.5 percent if needed having previously worried deeper cuts would roil money markets.
Meantime, Fed Chair Janet Yellen said last week that “if circumstances were to change” then “potentially anything, including negative interest rates, would be on the table.” One of her policy-setting colleagues has already advocated them for next year.
Plumbing new depths the next time economies stumble would continue the pattern of the past few decades in which each of the peaks and troughs in rates were more often than not lower than in the previous business cycle.
It appears that I am no longer the only person in Canada who understands that trailer fees are only one of many broker incentives:
Canadian Oil Sands Ltd. is accusing Suncor Energy Inc. of buying support for its $4.3-billion hostile takeover bid, as the largest Syncrude owner seeks more time to drum up a richer offer.
In a red, bold-lettered “warning” sign posted on its website, Canadian Oil Sands says Suncor is paying brokers to get Canadian Oil Sands’ investors to tender their shares – a strategy it says shows Suncor’s bid is “exploitive” and “opportunistic.”
“Knowing the weakness of their bid, they feel it is necessary to pay brokers and incentivize them to encourage clients to tender their shares,” the notice reads.
“We don’t think that’s right. We think our shareholders should decide for themselves, free from the influence of brokers being financially compensated to do Suncor’s work for them.”
I eagerly await cries of astonished horror from the regulators.
I ran across two good papers on sub-prime today; the first, by Christopher Palmer, is titled Why Did So Many Subprime Borrowers Default During the Crisis: Loose Credit or Plummeting Prices?�:
The foreclosure rate of subprime mortgages increased markedly across 2003-2007 borrower cohorts — subprime mortgages originated in 2006-2007 were roughly three times more likely to default within three years of origination than mortgages originated in 2003-2004. Many have argued that this surge in subprime defaults represents a deterioration in subprime lending standards over time. I quantify the importance of an alternative hypothesis: later cohorts defaulted at higher rates in large part because house price declines left them more likely to have negative equity. Using loan-level data, I find that changing borrower and loan characteristics explain approximately 30% of the difference in cohort default rates, with almost of all of the remaining heterogeneity across cohorts attributable to the price cycle. To account for the endogeneity of prices, I employ a nonlinear instrumental-variables approach that instruments for house price changes with long-run regional variation in house-price cyclicality. Control function results confirm that the relationship between price declines and defaults is causal and explains the majority of the disparity in cohort performance. I conclude that if 2006 borrowers had faced the same prices the average 2003 borrower did, their annual default
rate would have dropped from 12% to 5.6%.
The second, by Christopher L. Foote, Kristopher S. Gerardi and Paul S. Willen, is titled Why Did So Many People Make So Many Ex Post Bad Decisions? The Causes of the Foreclosure Crisis:
We present 12 facts about the mortgage crisis. We argue that the facts refute the popular story that the crisis resulted from finance industry insiders deceiving uninformed mortgage borrowers and investors. Instead, we argue that borrowers and investors made decisions that were rational and logical given their ex post overly optimistic beliefs about house prices. We then show that neither institutional features of the mortgage market nor financial innovations are any more likely to explain those wrong beliefs than they are to explain the Dutch tulip bubble 400 years ago. Economists should acknowledge the limits of our understanding of asset price bubbles and design policies accordingly
…
Fact 1: Resets of adjustable-rate mortgages did not cause the foreclosure crisis
…
Fact 2: No mortgage was “designed to fail”
…
Fact 3: There was little innovation in mortgage markets in the 2000s
…
Fact 4: Government policy toward the mortgage market did not change much from 1990 to 2005
…
Fact 5: The originate-to-distribute model was not new
…
Fact 6: MBSs, CDOs and other “complex financial products” had been widely used for decades
…
Fact 7: Mortgage investors had lots of information
…
Fact 8: Investors understood the risks
…
Fact 9: Investors were optimistic about house prices
…
Fact 10: Mortgage market insiders were the biggest losers
…
Fact 11: Mortgage market outsiders were the biggest winners
…
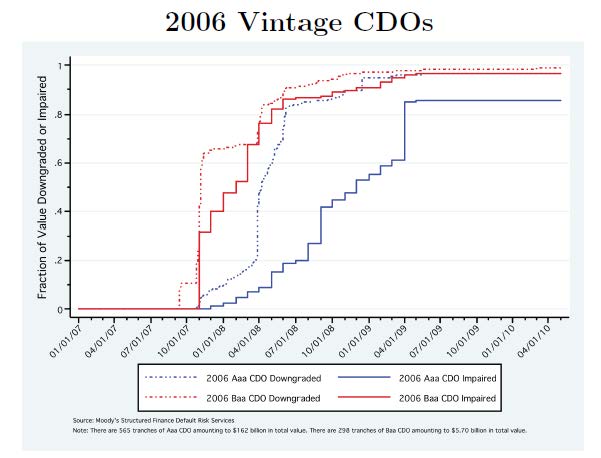
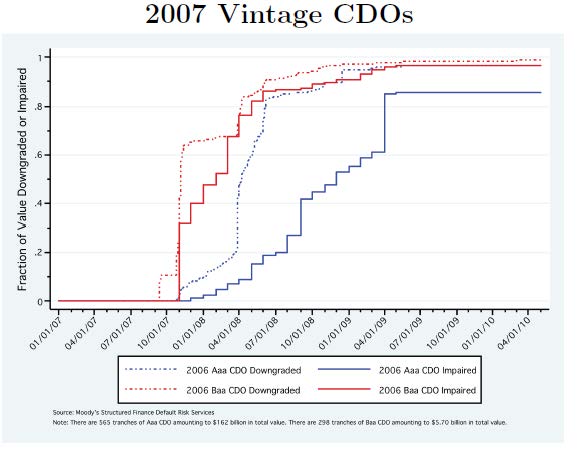
Fact 12: Top-rated bonds backed by mortgages did not turn out to be “toxic.” Top-rated bonds in collateralized debt obligations (CDOs) did.
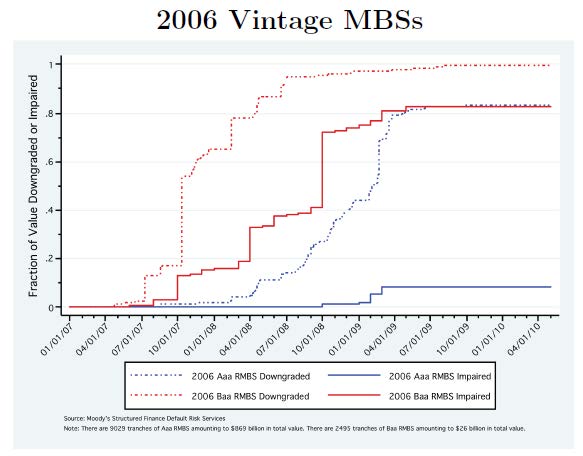
The best part of the latter paper is that for the first time I’ve found a little authoritative data on the default rate of AAA RMBS (politicians find it much more useful to talk about the downgrade rate):
To start with, the top-rated tranches of subprime securities fared better than many people realize. The top panel of Figure 9 is generated from data on AAA-rated bonds created in 2006 from private-label securitization deals.27 Specifically, the panel shows the fraction of these bonds on which investors suffered losses or, using industry jargon, the fraction that was “impaired.” In some of these deals, 70 percent of the underlying subprime loans terminated in foreclosure (Jozoff et al. 2012). Yet despite these massive losses, the figure shows that investors lost money on less than 10 percent of private-label AAA-rated securities. How is that possible? As many have explained, the AAA-rated securities were protected by a series of lower-rated securities which absorbed most of the losses. If a borrower defaulted and the lender was unable to recover the principal, the resulting loss would be deducted from the principal of the deal’s lower-rated tranches. For subprime deals, the degree of so-called AAA credit protection—the principal balance of the non-AAA securities—was often more than 20 percent. Given a 50 percent recovery rate on foreclosed loans, 20 percent credit protection meant that 40 percent of the borrowers could suffer foreclosure before the AAA rated investors suffered a single dollar of loss. For riskier deals, credit protection was higher, often substantially so. The key takeaway is that for subprime securities, credit protection largely worked, and investors in the AAA-rated securities were largely spared.
The relatively robust performance of private-label AAA-rated securities is explained clearly in the final report of the Financial Crisis Inquiry Commission (2011), among other sources. Yet it still surprises many people. If these AAA-rated securities didn’t suffer losses, where were the famous “toxic mortgage-related securities” that caused the financial crisis? The answer is that banks used lower-rated securities from private-label deals to construct other securities, such as the collateralized debt obligations (CDOs) discussed earlier. Recall that because these CDOs were backed by tranches of subprime securities, which were technically labeled asset-backed securities (ABS), the resulting CDOs were called ABS CDOs. The main difference between the original ABS and the ABS CDOs was that the CDOs were not backed by 2,000 or so subprime loans, but rather a collection of 90–100 lower-rated tranches of subprime ABS deals, with most of these tranches having BBB ratings. Yet the organizing principal of CDOs and the original ABS securities was the same: senior AAA-rated tranches were protected from losses by lower-rated tranches. For the original ABS, losses would occur if individual homeowners defaulted. For the CDOs, losses would occur if the BBB-rated securities from the original ABS deals defaulted.
 Click for Big
 Click for Big
 Click for Big
 Click for Big
Figure 9. Downgrades and Impairments Among Mortgage-Backed Securities (MBS) and Collateralized Debt Obligations (CDOs). The two panels on the left show that among private-label MBS, lower-rated tranches suffered massive losses. However, while a large fraction of AAA-rated tranches were downgraded, the vast majority of these tranches paid off, as few of them suffered actual impairments. The two panels on the right show that the same is not true for CDOs. Because these bonds tended to be backed by the lower-rated tranches of private-lable MBS, both the AAA-rated and the lower-rated tranches of CDOs suffered significant impairments. Source: Tables 12, 13, 17 and 18 in Financial Crisis Inquiry Commission (2010).
The difference between the ABS and CDO experiences has been discussed on PrefBlog previously, notably in the post Hull & White on AAA Tranches of Subprime.
I haven’t passed on any drone news lately … so here’s a fun drone story:
On a cool October night, after the stores in a shopping mall had closed, six young drone racers gathered in a subterranean parking garage to hone their aviation skills. Using remote-control joysticks, they navigated small X-shaped drones around pylons and beneath shopping carts, each vying for the lead.
The young men all work steady jobs, but racing drones, they said, has become a consuming new passion..
…
What the sport needs most at this stage is money, and in the last few months it has started to flow. In August, another organization, the Drone Racing League, announced a $1 million investment from the Miami Dolphins owner Stephen M. Ross through his investment arm RSE Ventures. The league’s chief executive, Nicholas Horbaczewski, would not reveal its plans, but he acknowledged reports that described races similar to video-game competitions held in large arenas. Horbaczewski said the company’s first major event would be in early 2016.
…
Pilots navigate the drones using a remote control with two joysticks that control altitude, speed and direction. They wear large goggles that broadcast live standard-definition video from a camera mounted on the front of the drone. It is this first-person-view technology, or F.P.V., that has given the sport a major boost, allowing pilots to feel as if they are in the drone. The experience, they said, is similar to the pod-racing scenes from “Star Wars: Episode I — The Phantom Menace.”
The drone frames are made of light but sturdy material like carbon fiber and are little more than small platforms for motors, a battery, electronic circuitry and four to six propellers. Most are of the four-motor variety and are thus better known among hobbyists as quadcopters, or quads, rather than drones.
“Three years ago, this technology was so expensive, so unattainable, that only the professional cinematographer could afford it,” [chief operating officer of the International Drone Racing Association Charles] Zablan said. Now, he said, a full racing kit with F.P.V. goggles can be bought for about $1,000.
It was a mixed day for the Canadian preferred share market, with PerpetualDiscounts gaining 4bp, FixedResets up 24bp and DeemedRetractibles off 14bp. The Performance Highlights table continues to show a lot of churn. Volume was average.
For as long as the FixedReset market is so violently unsettled, I’ll keep publishing updates of the more interesting and meaningful series of FixedResets’ Implied Volatilities. This doesn’t include Enbridge because although Enbridge has a large number of issues outstanding, all of which are quite liquid, the range of Issue Reset Spreads is too small for decent conclusions. The low is 212bp (ENB.PR.H; second-lowest is ENB.PR.D at 237bp) and the high is a mere 268 for ENB.PF.G.
Remember that all rich /cheap assessments are:
» based on Implied Volatility Theory only
» are relative only to other FixedResets from the same issuer
» assume constant GOC-5 yield
» assume constant Implied Volatility
» assume constant spread
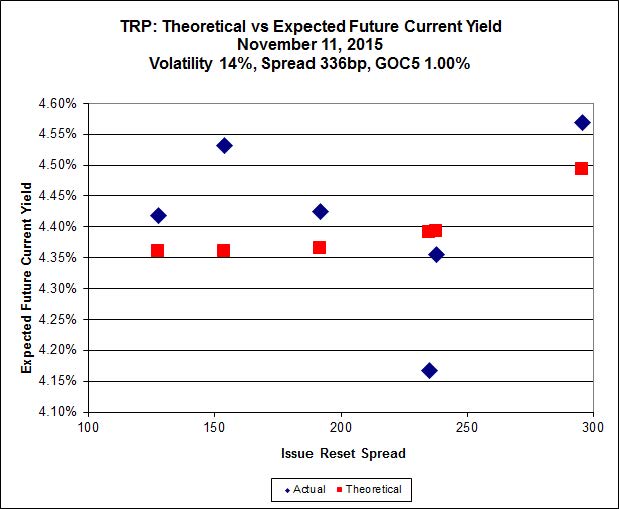
Here’s TRP:
 Click for Big
TRP.PR.E, which resets 2019-10-30 at +235, is bid at 20.10 to be $1.02 rich, while TRP.PR.C, resetting 2016-1-30 at +154, is $0.55 cheap at its bid price of 14.01.
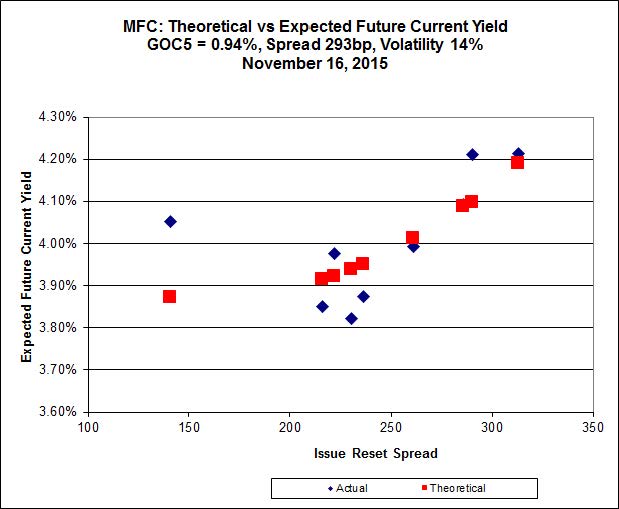
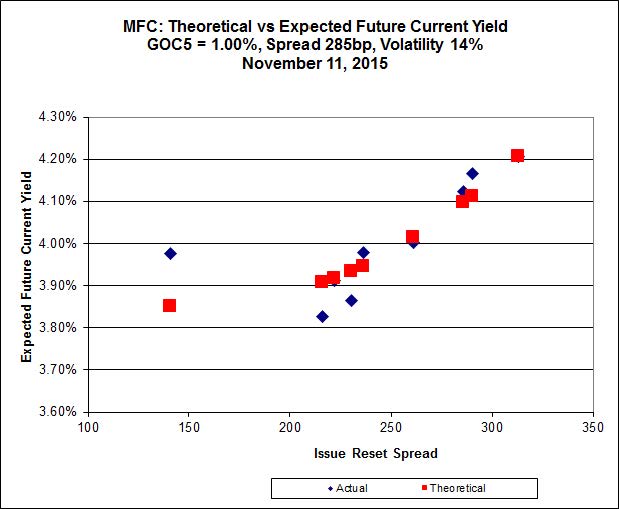
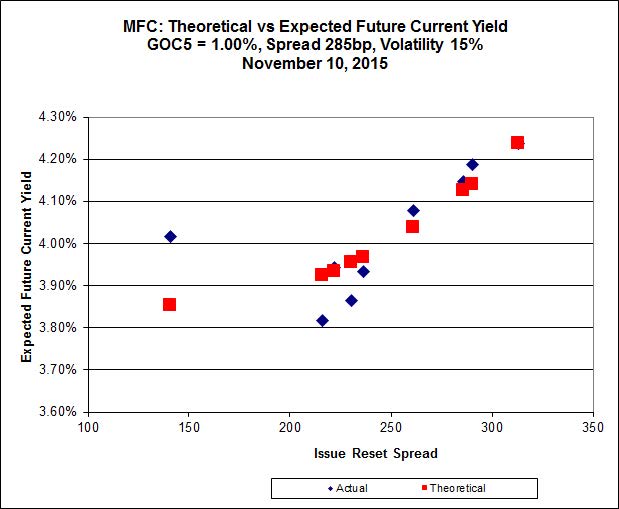
 Click for Big
Most expensive is MFC.PR.L, resetting at +216bp on 2019-6-19, bid at 20.65 to be 0.43 rich, while MFC.PR.F resetting at +141bp on 2016-6-19, is bid at 15.15 to be 0.50 cheap.
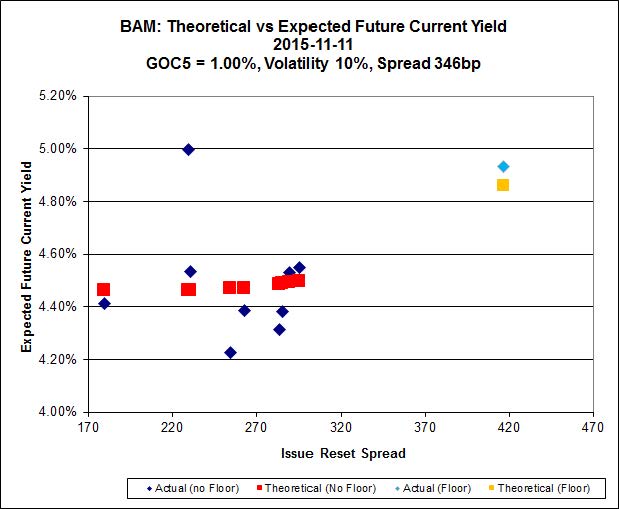
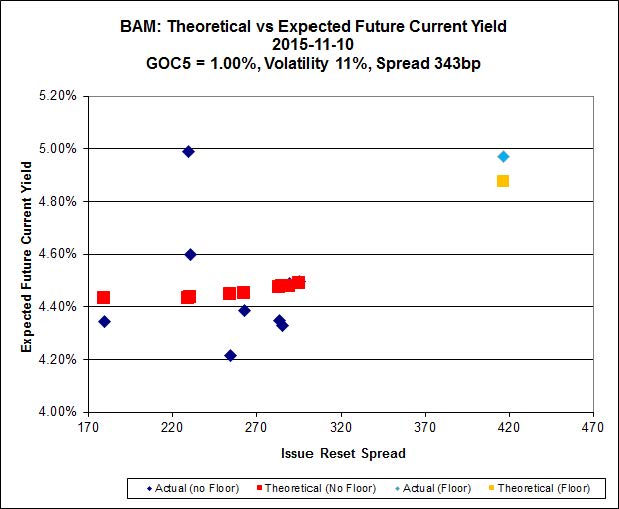
 Click for Big
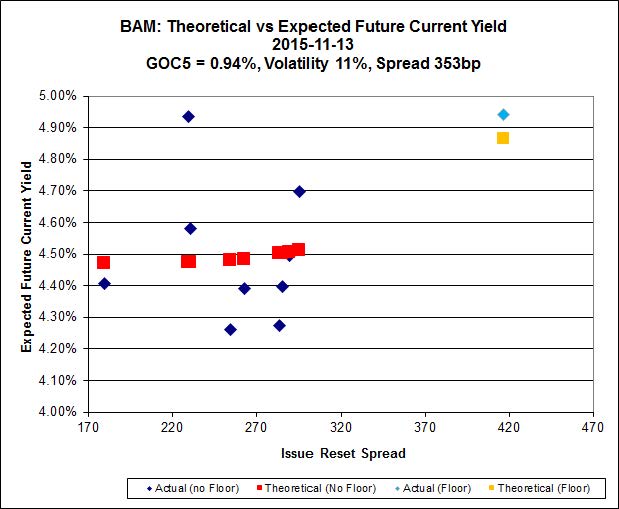
The cheapest issue relative to its peers is BAM.PR.R, resetting at +230bp on 2016-6-30, bid at 16.51 to be $1.98 cheap. BAM.PF.E, resetting at +255bp on 2020-3-31 is bid at 21.00 and appears to be $1.13 rich.
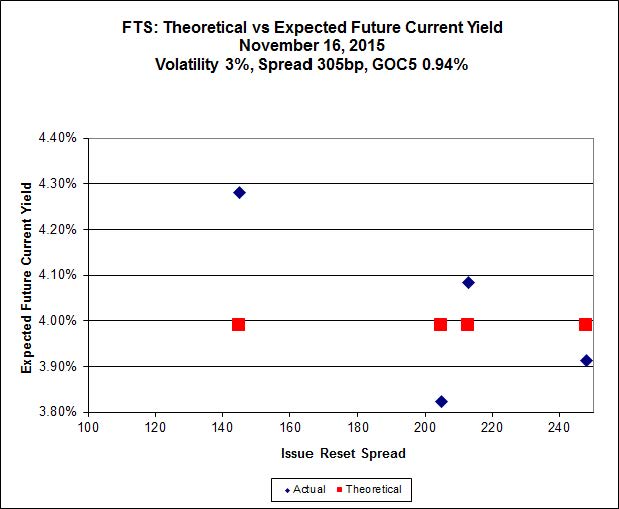
 Click for Big
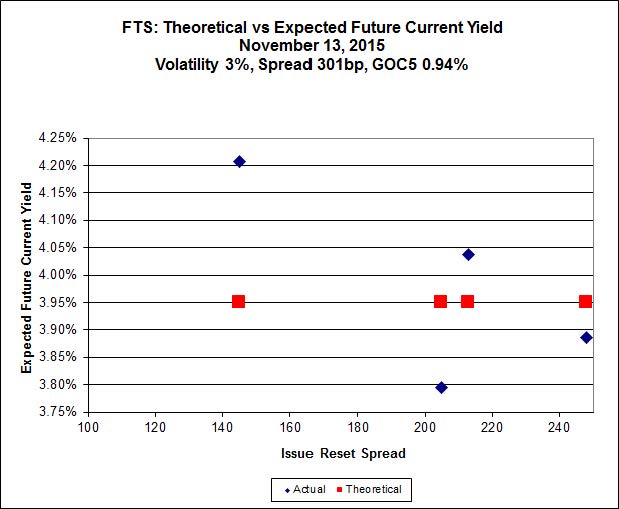
FTS.PR.K, with a spread of +205bp, and bid at 19.97, looks $0.86 expensive and resets 2019-3-1. FTS.PR.H, with a spread of +145bp and resetting 2020-6-1, is bid at 14.70 and is $0.65 cheap.
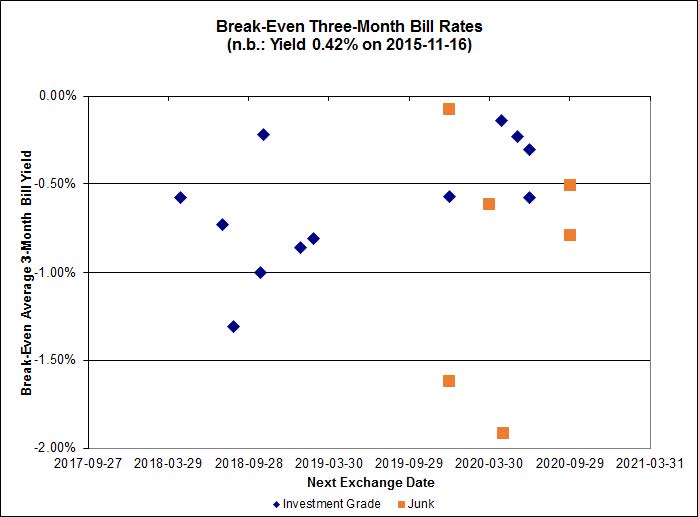
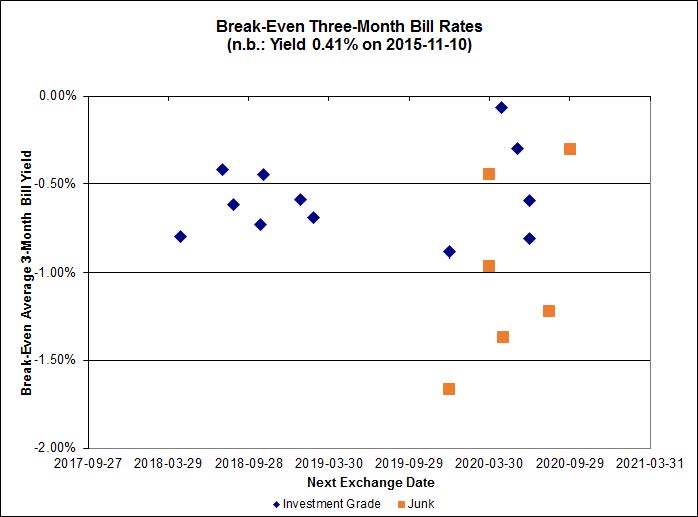
 Click for Big
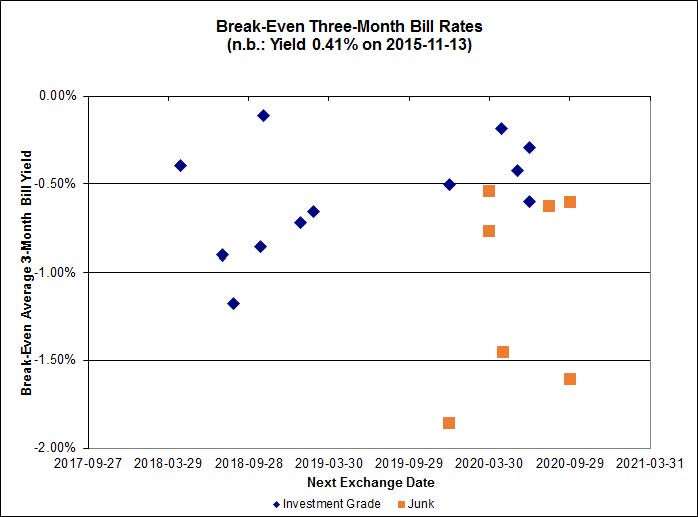
Investment-grade pairs predict an average three-month bill yield over the next five-odd years of -0.58%, with one outlier above 0.00%. There are two junk outliers above 0.00% and two below -2.00%.
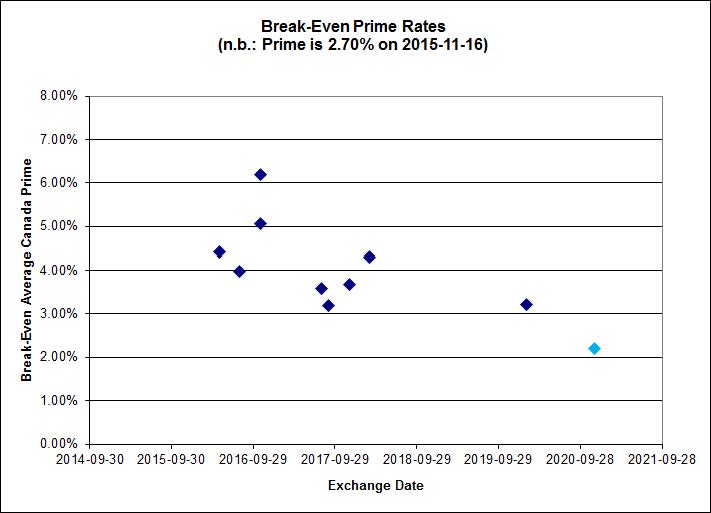
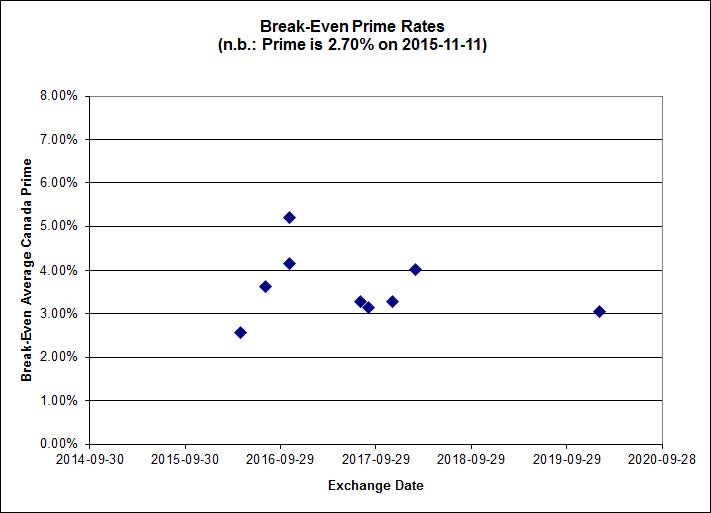
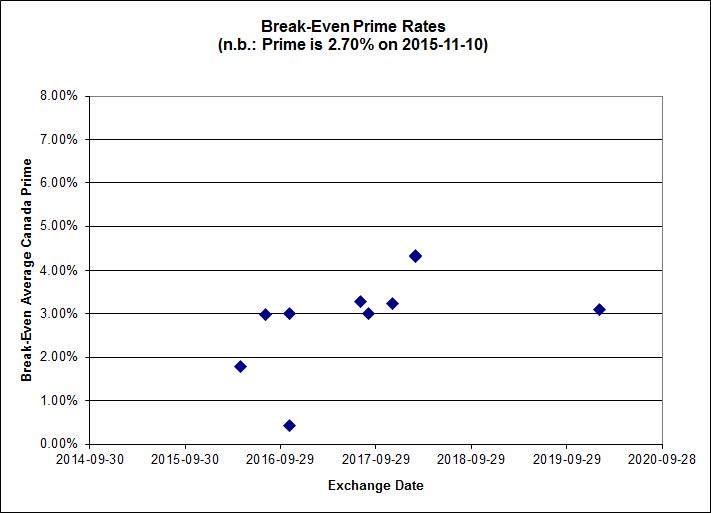
 Click for Big
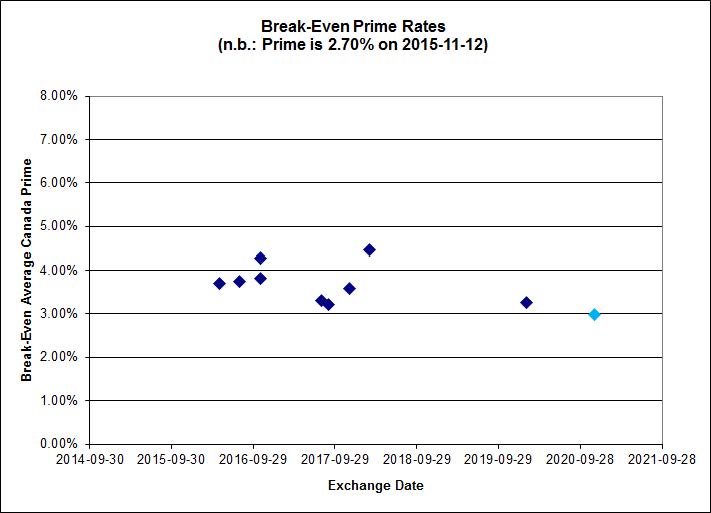
Shall we just say that this exhibits a high level of confidence in the continued rapacity of Canadian banks?
HIMIPref™ Preferred Indices
These values reflect the December 2008 revision of the HIMIPref™ Indices
Values are provisional and are finalized monthly |
| Index |
Mean
Current
Yield
(at bid) |
Median
YTW |
Median
Average
Trading
Value |
Median
Mod Dur
(YTW) |
Issues |
Day’s Perf. |
Index Value |
| Ratchet |
4.27 % |
5.12 % |
31,652 |
17.68 |
1 |
2.4984 % |
1,819.2 |
| FixedFloater |
6.06 % |
5.30 % |
28,946 |
17.16 |
1 |
-4.3319 % |
3,221.0 |
| Floater |
3.96 % |
4.01 % |
64,188 |
17.37 |
3 |
-2.7438 % |
1,994.4 |
| OpRet |
4.84 % |
4.56 % |
33,233 |
0.78 |
1 |
0.1187 % |
2,717.5 |
| SplitShare |
4.74 % |
5.58 % |
147,281 |
4.38 |
5 |
0.2806 % |
3,209.3 |
| Interest-Bearing |
0.00 % |
0.00 % |
0 |
0.00 |
0 |
0.2806 % |
2,504.0 |
| Perpetual-Premium |
5.81 % |
-1.14 % |
87,406 |
0.08 |
6 |
-0.0859 % |
2,500.3 |
| Perpetual-Discount |
5.51 % |
5.63 % |
83,445 |
14.46 |
33 |
0.0448 % |
2,594.0 |
| FixedReset |
4.76 % |
4.47 % |
227,964 |
15.57 |
76 |
0.2374 % |
2,149.2 |
| Deemed-Retractible |
5.17 % |
5.21 % |
108,240 |
5.42 |
34 |
-0.1377 % |
2,585.1 |
| FloatingReset |
2.57 % |
3.76 % |
55,157 |
5.78 |
10 |
-0.4711 % |
2,191.5 |
| Performance Highlights |
| Issue |
Index |
Change |
Notes |
| TRP.PR.B |
FixedReset |
-4.80 % |
YTW SCENARIO
Maturity Type : Limit Maturity
Maturity Date : 2045-11-11
Maturity Price : 12.90
Evaluated at bid price : 12.90
Bid-YTW : 4.47 % |
| BAM.PR.G |
FixedFloater |
-4.33 % |
YTW SCENARIO
Maturity Type : Limit Maturity
Maturity Date : 2045-11-11
Maturity Price : 25.00
Evaluated at bid price : 15.68
Bid-YTW : 5.30 % |
| BAM.PR.B |
Floater |
-3.38 % |
YTW SCENARIO
Maturity Type : Limit Maturity
Maturity Date : 2045-11-11
Maturity Price : 12.00
Evaluated at bid price : 12.00
Bid-YTW : 3.97 % |
| BAM.PR.K |
Floater |
-3.33 % |
YTW SCENARIO
Maturity Type : Limit Maturity
Maturity Date : 2045-11-11
Maturity Price : 11.90
Evaluated at bid price : 11.90
Bid-YTW : 4.01 % |
| TRP.PR.A |
FixedReset |
-2.94 % |
YTW SCENARIO
Maturity Type : Limit Maturity
Maturity Date : 2045-11-11
Maturity Price : 16.50
Evaluated at bid price : 16.50
Bid-YTW : 4.65 % |
| FTS.PR.G |
FixedReset |
-1.74 % |
YTW SCENARIO
Maturity Type : Limit Maturity
Maturity Date : 2045-11-11
Maturity Price : 19.16
Evaluated at bid price : 19.16
Bid-YTW : 4.36 % |
| BMO.PR.R |
FloatingReset |
-1.74 % |
YTW SCENARIO
Maturity Type : Hard Maturity
Maturity Date : 2022-01-31
Maturity Price : 25.00
Evaluated at bid price : 22.60
Bid-YTW : 3.73 % |
| BAM.PR.X |
FixedReset |
-1.55 % |
YTW SCENARIO
Maturity Type : Limit Maturity
Maturity Date : 2045-11-11
Maturity Price : 15.86
Evaluated at bid price : 15.86
Bid-YTW : 4.79 % |
| BAM.PR.C |
Floater |
-1.49 % |
YTW SCENARIO
Maturity Type : Limit Maturity
Maturity Date : 2045-11-11
Maturity Price : 11.90
Evaluated at bid price : 11.90
Bid-YTW : 4.01 % |
| SLF.PR.J |
FloatingReset |
-1.43 % |
YTW SCENARIO
Maturity Type : Hard Maturity
Maturity Date : 2025-01-31
Maturity Price : 25.00
Evaluated at bid price : 13.80
Bid-YTW : 9.15 % |
| TD.PR.T |
FloatingReset |
-1.32 % |
YTW SCENARIO
Maturity Type : Hard Maturity
Maturity Date : 2022-01-31
Maturity Price : 25.00
Evaluated at bid price : 22.50
Bid-YTW : 3.76 % |
| BAM.PF.F |
FixedReset |
-1.26 % |
YTW SCENARIO
Maturity Type : Limit Maturity
Maturity Date : 2045-11-11
Maturity Price : 21.71
Evaluated at bid price : 22.02
Bid-YTW : 4.61 % |
| SLF.PR.G |
FixedReset |
-1.23 % |
YTW SCENARIO
Maturity Type : Hard Maturity
Maturity Date : 2025-01-31
Maturity Price : 25.00
Evaluated at bid price : 15.26
Bid-YTW : 8.63 % |
| BAM.PR.Z |
FixedReset |
-1.18 % |
YTW SCENARIO
Maturity Type : Limit Maturity
Maturity Date : 2045-11-11
Maturity Price : 21.42
Evaluated at bid price : 21.76
Bid-YTW : 4.76 % |
| IAG.PR.A |
Deemed-Retractible |
-1.14 % |
YTW SCENARIO
Maturity Type : Hard Maturity
Maturity Date : 2025-01-31
Maturity Price : 25.00
Evaluated at bid price : 21.66
Bid-YTW : 6.68 % |
| TRP.PR.F |
FloatingReset |
-1.13 % |
YTW SCENARIO
Maturity Type : Limit Maturity
Maturity Date : 2045-11-11
Maturity Price : 14.90
Evaluated at bid price : 14.90
Bid-YTW : 3.93 % |
| MFC.PR.M |
FixedReset |
-1.12 % |
YTW SCENARIO
Maturity Type : Hard Maturity
Maturity Date : 2025-01-31
Maturity Price : 25.00
Evaluated at bid price : 21.11
Bid-YTW : 5.97 % |
| MFC.PR.F |
FixedReset |
1.00 % |
YTW SCENARIO
Maturity Type : Hard Maturity
Maturity Date : 2025-01-31
Maturity Price : 25.00
Evaluated at bid price : 15.15
Bid-YTW : 9.09 % |
| RY.PR.J |
FixedReset |
1.04 % |
YTW SCENARIO
Maturity Type : Limit Maturity
Maturity Date : 2045-11-11
Maturity Price : 21.92
Evaluated at bid price : 22.38
Bid-YTW : 4.15 % |
| TD.PF.C |
FixedReset |
1.10 % |
YTW SCENARIO
Maturity Type : Limit Maturity
Maturity Date : 2045-11-11
Maturity Price : 20.14
Evaluated at bid price : 20.14
Bid-YTW : 4.24 % |
| TRP.PR.E |
FixedReset |
1.11 % |
YTW SCENARIO
Maturity Type : Limit Maturity
Maturity Date : 2045-11-11
Maturity Price : 20.10
Evaluated at bid price : 20.10
Bid-YTW : 4.47 % |
| TRP.PR.G |
FixedReset |
1.12 % |
YTW SCENARIO
Maturity Type : Limit Maturity
Maturity Date : 2045-11-11
Maturity Price : 21.39
Evaluated at bid price : 21.67
Bid-YTW : 4.54 % |
| CM.PR.P |
FixedReset |
1.32 % |
YTW SCENARIO
Maturity Type : Limit Maturity
Maturity Date : 2045-11-11
Maturity Price : 19.91
Evaluated at bid price : 19.91
Bid-YTW : 4.28 % |
| IAG.PR.G |
FixedReset |
1.38 % |
YTW SCENARIO
Maturity Type : Hard Maturity
Maturity Date : 2025-01-31
Maturity Price : 25.00
Evaluated at bid price : 22.76
Bid-YTW : 5.30 % |
| BAM.PR.T |
FixedReset |
1.39 % |
YTW SCENARIO
Maturity Type : Limit Maturity
Maturity Date : 2045-11-11
Maturity Price : 18.25
Evaluated at bid price : 18.25
Bid-YTW : 4.80 % |
| IFC.PR.C |
FixedReset |
1.50 % |
YTW SCENARIO
Maturity Type : Hard Maturity
Maturity Date : 2025-01-31
Maturity Price : 25.00
Evaluated at bid price : 20.35
Bid-YTW : 6.57 % |
| PWF.PR.T |
FixedReset |
1.75 % |
YTW SCENARIO
Maturity Type : Limit Maturity
Maturity Date : 2045-11-11
Maturity Price : 22.23
Evaluated at bid price : 22.70
Bid-YTW : 3.88 % |
| MFC.PR.J |
FixedReset |
1.90 % |
YTW SCENARIO
Maturity Type : Hard Maturity
Maturity Date : 2025-01-31
Maturity Price : 25.00
Evaluated at bid price : 22.55
Bid-YTW : 5.20 % |
| TD.PF.D |
FixedReset |
2.18 % |
YTW SCENARIO
Maturity Type : Limit Maturity
Maturity Date : 2045-11-11
Maturity Price : 22.29
Evaluated at bid price : 23.00
Bid-YTW : 4.08 % |
| SLF.PR.H |
FixedReset |
2.36 % |
YTW SCENARIO
Maturity Type : Hard Maturity
Maturity Date : 2025-01-31
Maturity Price : 25.00
Evaluated at bid price : 19.10
Bid-YTW : 6.87 % |
| BAM.PR.E |
Ratchet |
2.50 % |
YTW SCENARIO
Maturity Type : Limit Maturity
Maturity Date : 2045-11-11
Maturity Price : 25.00
Evaluated at bid price : 16.00
Bid-YTW : 5.12 % |
| IFC.PR.A |
FixedReset |
3.03 % |
YTW SCENARIO
Maturity Type : Hard Maturity
Maturity Date : 2025-01-31
Maturity Price : 25.00
Evaluated at bid price : 17.00
Bid-YTW : 8.36 % |
| Volume Highlights |
| Issue |
Index |
Shares
Traded |
Notes |
| TRP.PR.D |
FixedReset |
73,026 |
YTW SCENARIO
Maturity Type : Limit Maturity
Maturity Date : 2045-11-11
Maturity Price : 19.40
Evaluated at bid price : 19.40
Bid-YTW : 4.58 % |
| TRP.PR.E |
FixedReset |
48,335 |
YTW SCENARIO
Maturity Type : Limit Maturity
Maturity Date : 2045-11-11
Maturity Price : 20.10
Evaluated at bid price : 20.10
Bid-YTW : 4.47 % |
| BAM.PF.A |
FixedReset |
37,825 |
YTW SCENARIO
Maturity Type : Limit Maturity
Maturity Date : 2045-11-11
Maturity Price : 21.24
Evaluated at bid price : 21.52
Bid-YTW : 4.72 % |
| TD.PF.A |
FixedReset |
22,048 |
YTW SCENARIO
Maturity Type : Limit Maturity
Maturity Date : 2045-11-11
Maturity Price : 20.30
Evaluated at bid price : 20.30
Bid-YTW : 4.22 % |
| BMO.PR.S |
FixedReset |
21,359 |
YTW SCENARIO
Maturity Type : Limit Maturity
Maturity Date : 2045-11-11
Maturity Price : 20.42
Evaluated at bid price : 20.42
Bid-YTW : 4.28 % |
| TD.PR.Z |
FloatingReset |
20,800 |
YTW SCENARIO
Maturity Type : Hard Maturity
Maturity Date : 2022-01-31
Maturity Price : 25.00
Evaluated at bid price : 22.77
Bid-YTW : 3.64 % |
| There were 35 other index-included issues trading in excess of 10,000 shares. |
| Wide Spread Highlights |
| Issue |
Index |
Quote Data and Yield Notes |
| TRP.PR.B |
FixedReset |
Quote: 12.90 – 13.70
Spot Rate : 0.8000
Average : 0.4996
YTW SCENARIO
Maturity Type : Limit Maturity
Maturity Date : 2045-11-11
Maturity Price : 12.90
Evaluated at bid price : 12.90
Bid-YTW : 4.47 % |
| BAM.PR.X |
FixedReset |
Quote: 15.86 – 16.65
Spot Rate : 0.7900
Average : 0.5528
YTW SCENARIO
Maturity Type : Limit Maturity
Maturity Date : 2045-11-11
Maturity Price : 15.86
Evaluated at bid price : 15.86
Bid-YTW : 4.79 % |
| CU.PR.D |
Perpetual-Discount |
Quote: 22.40 – 22.92
Spot Rate : 0.5200
Average : 0.3677
YTW SCENARIO
Maturity Type : Limit Maturity
Maturity Date : 2045-11-11
Maturity Price : 22.10
Evaluated at bid price : 22.40
Bid-YTW : 5.47 % |
| BAM.PR.G |
FixedFloater |
Quote: 15.68 – 16.50
Spot Rate : 0.8200
Average : 0.7006
YTW SCENARIO
Maturity Type : Limit Maturity
Maturity Date : 2045-11-11
Maturity Price : 25.00
Evaluated at bid price : 15.68
Bid-YTW : 5.30 % |
| GWO.PR.N |
FixedReset |
Quote: 13.90 – 14.34
Spot Rate : 0.4400
Average : 0.3301
YTW SCENARIO
Maturity Type : Hard Maturity
Maturity Date : 2025-01-31
Maturity Price : 25.00
Evaluated at bid price : 13.90
Bid-YTW : 9.94 % |
| BAM.PR.B |
Floater |
Quote: 12.00 – 12.28
Spot Rate : 0.2800
Average : 0.1798
YTW SCENARIO
Maturity Type : Limit Maturity
Maturity Date : 2045-11-11
Maturity Price : 12.00
Evaluated at bid price : 12.00
Bid-YTW : 3.97 % |