Interesting External Papers

Natural Level of Interest Rates

Assiduous Readers will know I often use the Interesting External Papers section of PrefBlog as my notepad when reviewing the literature for my own purposes. And that is exactly what this post is … not so much for readers’ information, but for mine, when I want to find this stuff again!

The Bank of Canada Review of Spring 2003 contained an essay by David Longworth, Deputy Governor and life-time employee of the Bank, titled Inflation Targeting and Medium Term Planning: Some Simple Rules of Thumb:

Real long-term bond rates typically average slightly above long-term real growth rates.

Footnote: This has tended to be the case in Canada over the last 20 years. Economic theory would suggest that the real rate of return on capital would exceed the real growth rate of the economy. As long as the risk premium on private capital relative to government bonds is not too large, we would also expect that the real yield on government bonds would be slightly higher than the real growth of the economy. All this is strictly true only in a closed economy. In a small open economy, this real interest rate would reflect the world real interest rate, which in turn would reflect the real growth rate of the world economy.

The Congressional Budget Office has published its December 2007 Background Paper: How CBO Projects the Real Rate of Interest on 10-Year Treasury Notes:

This background paper summarizes CBO’s methods for calculating the natural rate of interest and applying it in projections of the real and nominal interest rates on 10-year Treasury notes.

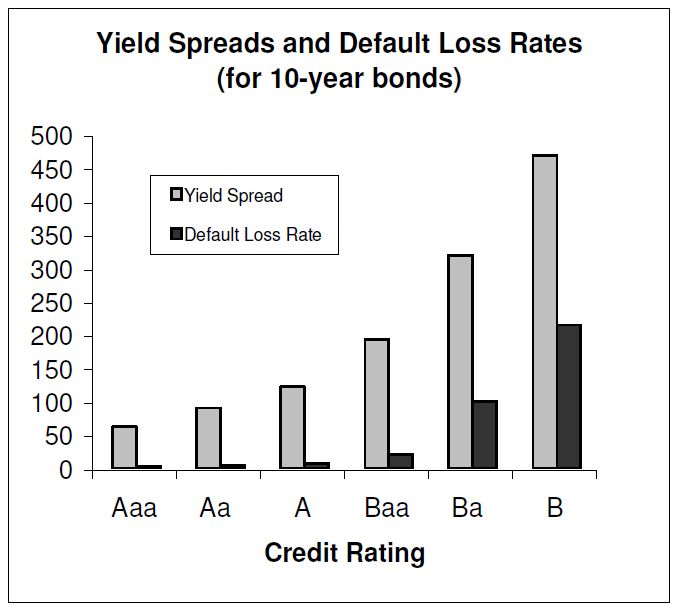
Estimating the natural rate of interest, either over history or for projections, is a two-step procedure. First, CBO estimates the real return on capital (adjusted for taxes on profits). That estimate is based on the agency’s view of the economy’s physical production process—how capital and labor are used to produce output and generate complementary income payments to capital and labor. Because all output simultaneously generates income, data from either the income side or the product (output) side of the national income and product accounts (NIPAs), compiled by the Bureau of Economic Analysis, can be used. Second, CBO estimates an adjustment for the risk in actually realizing the return on capital. Because part of the return on capital is compensation for the risk that some firms will default and inflict losses on investors, an estimate of the real rate based on income payments from capital is higher than the natural rate. Therefore, that risk premium must be removed to yield an estimate of the natural rate. That rate is comparable to the real rate on 10-year Treasury notes, which is also free of default risk. In particular, the risk premium is based on a weighted average of separate estimates of the risk of holding equity and debt claims on capital; it also includes an adjustment for the different tax treatment of profits and interest payments generated by businesses.

Over the next 10 years, CBO projects, the natural rate of interest will decline slightly, from an estimated level of about 3.6 percent in 2006 to about 3 percent. That decline stems from a projected decline in the return on capital, much of which reflects a projected slowdown in the growth of the labor force.

CBO uses two complementary approaches for estimating the return on capital, one from the income side and the other from the product, or production, side.1 The income-based approach measures the rate of return on capital as the ratio of capital income to the capital stock. Its construction has the advantage of being independent of assumptions about production relationships or determinations of whether the economy is in or out of equilibrium. It provides a relatively smooth estimate of the return on capital over the historical and projection periods.

The income-side measure is estimated as the ratio of capital income to the capital stock (see Figure 2). Capital income is a domestic private-sector concept estimated as the sum of domestic corporate profits, people’s rental income, 35 percent of proprietors’ income, and interest paid by domestic businesses, using data from the NIPAs2,3 The private-sector capital stock, valued at the prices of newly produced investment goods, consists of businesses’ plant (that is, facilities) and equipment, software, inventories, housing, and land—all valued at current market prices.

The income-side measure of the return on capital has both cyclical and trend components. From 1960 to 1970 and from 1991 to 2001, the return rose during the recoveries from recessions and peaked during the expansions, before falling as the expansions matured. Across business cycles, the return has exhibited extended periods in which the underlying trend was falling (as from 1960 to 1980) and then rising (from 1980 to the late 1990s).

The estimate of the natural rate of interest is obtained by adjusting the real return on capital (in this instance, the income-side measure) for both tax effects and the combined risk premium (see Figure 7).


Click for big

Thomas Laubach & John C. Williams, Measuring the Natural Rate of Interest:

A key variable for the conduct of monetary policy is the natural rate of interest – the real interest rate consistent with output equaling potential and stable inflation. Economic theory implies that the natural rate of interest varies over time and depends on the trend growth rate of output. In this paper we apply the Kalman filter to jointly estimate the natural rate of interest, potential output, and the trend growth rate, and examine the empirical relationship between these estimated unobserved series. We find substantial variation in the natural rate of interest over the past four decades in the United States. Our natural rate estimates vary about one-for-one with changes in the trend growth rate. We show that policymakers’ mismeasurement of the natural rate of interest can cause a significant deterioration in macroeconomic stabilization.

FRBSF Economic Letter, 2003-10-31:

Importantly, the natural rate of interest can change, because highly persistent changes in aggregate supply and demand can shift the lines. For example, in a recent paper, Laubach (2003) finds that increases in long-run projections of federal government budget deficits are related to increases in expected long-term real interest rates; in Figure 1, an increase in long-run projected budget deficits would be represented by a rightward shift in the IS curve and a higher natural rate. In addition, economic theory suggests that when the trend growth rate of potential GDP rises, so does the natural rate of interest (see Laubach and Williams (2003) for supporting evidence).

Interesting External Papers

Breakeven Inflation and Inflation Expectations

Econbrowser‘s Menzie Chinn wrote a recent post asking everybody to take a deep breath and calm down a little about inflation, titled High Anxiety (about Interest and Inflation Rates):

Of course, the United States in 2009 is different than Japan in 2001. One key difference is that Japan was, and remains, a net creditor. America is a big net debtor to the rest of the world, with extremely large holdings of US Treasurys by foreign private and state actors. And so, for me, I worry more about higher real interest rates (portfolio balance effects) than higher inflation. But even here, real yields according to TIPS seems fairly low in historical perspective (and roughly comparable to those prevailing during the period characterized as “the saving glut”).

My bottom line: Think, and recollect, before panicking.

In the post, he referenced a paper by Stefania D’Amico, Don H. Kim and Min Wei (all of the Fed’s Division of Monetary Affairs), Tips from TIPS: The Informational Content of Treasury Inflation-Protected Security Prices:

We examine the informational content of TIPS yields from the viewpoint of a general 3-factor no-arbitrage term structure model of inflation and interest rates. Our empirical results indicate that TIPS yields contained a “liquidity premium” that was until recently quite large (~ 1%). Key features of this premium are difficult to account for in a rational pricing framework, suggesting that TIPS may not have been priced efficiently in its early years. Besides the liquidity premium, a time-varying inflation risk premium complicates the interpretation of the TIPS breakeven inflation rate (the difference between the nominal and TIPS yields). Nonetheless, high-frequency variation in the TIPS breakeven rates is similar to the variation in inflation expectations implied by the model, lending support to the view that TIPS breakeven inflation rates are a useful proxy for inflation expectations.

This paper was cited by Grishenko & Huang (which has been discussed on PrefBlog), who emphasize:

In a related study, the long-run averages of inflation risk premium in D’Amico, Kim, and Wei (2006) can be positive or negative depending on the different series that they use to fit the three-factor term-structure model.

Footnote: See Figures 4 through 6 in their paper.

Back to D’Amico et al.:

Specifically, we model the dynamics of nominal yields, inflation, and TIPS yields in a general no-arbitrage term structure model setting, and examine the extent to which these data are consistent with each other. Furthermore, we seek to establish some basic facts about the real term structure and the inflation risk premia implicit in nominal bond yields and to obtain an estimate of the “liquidity premium” in TIPS yields.

Our main results can be summarized as follows. In all the cases that we have examined, estimating the model taking TIPS yields at their face value fails to produce plausible estimates of inflation expectations or inflation risk premia. The difference between the observed TIPS yields and the model-implied real yields estimated without TIPS data indicates that the “liquidity premium” was quite large in the early years of TIPS’s existence, but has become smaller recently. This liquidity premium turns out to be difficult to account for within a simple rational pricing framework, suggesting that TIPS may not have been priced efficiently in their early years. Nonetheless, time variation in TIPS-based and model-implied breakeven rates are quite similar, suggesting that changes in the TIPS breakeven rates largely reflects changes in inflation expectations or in the investors’ attitude toward inflation risks, rather than being random movements.

They conclude:

The answer to the question of whether the TIPS breakeven rate can be taken as inflation expectation is more complicated. We find that the weekly changes in the model-implied 10-year inflation expectation tend to line up with the weekly changes in the 10-year TIPS breakeven rate. However, we also find that time variation in the inflation risk premium and the TIPS liquidity premium, the latter of which may also include other unaccounted-for effects, are often significant enough to drive a wedge between the qualitative behavior of the breakeven rates and inflation expectations. Our findings in this paper provide support for the use of TIPS breakeven rate information as a proxy for inflation expectations, but also provide a justification for caution. Indeed, in speeches that touch on inflation, policy makers often refer to the TIPS breakeven rate, but they also recognize that the interpretation of this measure is complicated by inflation risk premia and liquidity issues and then continue to monitor a large number of variables to gauge inflation expectations and underlying inflation pressures. More data and more work on TIPS modeling in the future will ndoubtedly shed more light on the informational content of TIPS prices.

Market Action

June 5, 2009

The recession is getting worse more slowly than expected:

Payrolls fell by 345,000, the least in eight months, after a revised 504,000 loss in April, the Labor Department said today in Washington. The jobless rate increased to 9.4 percent, the highest since 1983, in part as more people joined the labor force to look for work.

“The recession is very close to an end,” said Nariman Behravesh, chief economist at IHS Global Insight in Lexington, Massachusetts, whose payrolls forecast matched the closest estimate in a Bloomberg News survey. “The labor market is still pretty awful, but vastly better than it was.”

The jobs number had an immediate effect on Treasuries:

Yields on two-year Treasuries increased 28 basis points to 1.24 percent, the biggest one-day increase since Sept. 20. The price on the benchmark 0.875 percent note maturing in May 2011 fell 17/32, or $5.31 per $1,000 face value to 99 98/32, according to BGCantor Market Data.

Implied yields on eurodollar futures as well as federal fund futures contracts, both used to speculate on changes in central-bank policy, surged, with further-deferred contracts posting the largest increases. The yield on the December 2009 eurodollar contract rose 26 basis points today to 1.26 percent, while the December federal-funds futures contract yield increased 21 basis points to 0.54 percent.

Fed-funds futures contracts, which traded on the Chicago Board of Trade, show traders see a 65.7 percent probability the central bank will lift its target rate for overnight bank borrowing by at least 0.5 percent by November from its current zero-to-0.25 percent range. That’s up from 26.8 percent odds yesterday.

But Across the Curve thinks this is ludicrous:

Someone just pointed out that typically the Federal Reserve does not raise rates and unravel an ease until there has been at least six months of job growth. So any possibility of the FOMC raising rates this year is virtually nil.

The trade today is about position management. The entire world is (was) long the yield curve. Profit taking began and forced more profit taking as investors and traders dis not want to watch profits evaporate.

The Canadian jobs picture was awful, but you will look in vain for any worst-case scenarios in 5-year-old government budget documents to assess the effectiveness of contingency planning.

The Kansas City Fed has released its Spring 2009 edition of TEN, it’s general-readership publication. It reprints a speech by Thomas Hoenig, the President, titled “Too Big has Failed”, which mainly addresses current and future cures, rather than prevention. He does note:

We must also look for other ways to limit the creation and growth of firms that might be considered “too big to fail”.

… without making any suggestions. There’s also an article on the markets in water which many will find of interest; I continue to believe that Cleveland will rise again due to its proximity to the Great Lakes; just maybe not this century.

In these uncertain times, it is difficult for regulators to decide what to do. There’s no rule-book, precedents are scarce and there is a high risk of unintended consequences. It is therefore a pleasure to see that in the case of Bank of America, increased regulatory scrutiny – not to mention increased regulatory bullying, with Hank Paulson as the primary enforcer, as mentioned on May 14 – has achieved its objective:

Bank of America Corp., facing the biggest projected losses among lenders subjected to stress tests, will remake its board by adding two ex-regulators and two former bankers as directors.

The new directors are Susan Bies, 62, a former Federal Reserve Board governor; Donald Powell, 67, an ex-Federal Deposit Insurance Corp. chairman;

Now all they have to do is get rid of those damn bankers…

The preferred market continued its ascent today on continued good volume.

HIMIPref™ Preferred Indices
These values reflect the December 2008 revision of the HIMIPref™ Indices

Values are provisional and are finalized monthly
Index Mean
Current
Yield
(at bid)
Median
YTW
Median
Average
Trading
Value
Median
Mod Dur
(YTW)
Issues Day’s Perf. Index Value
Ratchet 0.00 % 0.00 % 0 0.00 0 0.4643 % 1,312.1
FixedFloater 7.20 % 5.72 % 30,356 15.99 1 0.0000 % 2,094.7
Floater 2.87 % 3.31 % 79,520 18.89 3 0.4643 % 1,639.2
OpRet 4.99 % 3.76 % 137,311 0.95 14 0.1164 % 2,174.8
SplitShare 5.91 % 6.09 % 53,433 4.26 3 0.4516 % 1,845.4
Interest-Bearing 5.92 % -0.83 % 26,119 0.08 1 1.4000 % 2,015.0
Perpetual-Premium 0.00 % 0.00 % 0 0.00 0 0.1393 % 1,731.6
Perpetual-Discount 6.34 % 6.34 % 162,399 13.44 71 0.1393 % 1,594.7
FixedReset 5.70 % 4.75 % 575,869 4.43 39 0.2515 % 2,002.5
Performance Highlights
Issue Index Change Notes
BAM.PR.B Floater 1.10 % YTW SCENARIO
Maturity Type : Limit Maturity
Maturity Date : 2039-06-05
Maturity Price : 11.94
Evaluated at bid price : 11.94
Bid-YTW : 3.33 %
TD.PR.G FixedReset 1.15 % YTW SCENARIO
Maturity Type : Call
Maturity Date : 2014-05-30
Maturity Price : 25.00
Evaluated at bid price : 27.31
Bid-YTW : 4.36 %
BAM.PR.I OpRet 1.17 % YTW SCENARIO
Maturity Type : Soft Maturity
Maturity Date : 2013-12-30
Maturity Price : 25.00
Evaluated at bid price : 24.31
Bid-YTW : 6.51 %
IAG.PR.C FixedReset 1.19 % YTW SCENARIO
Maturity Type : Call
Maturity Date : 2014-01-30
Maturity Price : 25.00
Evaluated at bid price : 25.59
Bid-YTW : 5.56 %
BMO.PR.K Perpetual-Discount 1.27 % YTW SCENARIO
Maturity Type : Limit Maturity
Maturity Date : 2039-06-05
Maturity Price : 21.29
Evaluated at bid price : 21.58
Bid-YTW : 6.12 %
STW.PR.A Interest-Bearing 1.40 % YTW SCENARIO
Maturity Type : Call
Maturity Date : 2009-07-05
Maturity Price : 10.00
Evaluated at bid price : 10.14
Bid-YTW : -0.83 %
ELF.PR.F Perpetual-Discount 1.62 % YTW SCENARIO
Maturity Type : Limit Maturity
Maturity Date : 2039-06-05
Maturity Price : 18.80
Evaluated at bid price : 18.80
Bid-YTW : 7.19 %
RY.PR.N FixedReset 1.75 % YTW SCENARIO
Maturity Type : Call
Maturity Date : 2014-03-26
Maturity Price : 25.00
Evaluated at bid price : 26.80
Bid-YTW : 4.65 %
MFC.PR.B Perpetual-Discount 1.83 % YTW SCENARIO
Maturity Type : Limit Maturity
Maturity Date : 2039-06-05
Maturity Price : 18.90
Evaluated at bid price : 18.90
Bid-YTW : 6.18 %
BAM.PR.N Perpetual-Discount 1.92 % YTW SCENARIO
Maturity Type : Limit Maturity
Maturity Date : 2039-06-05
Maturity Price : 15.40
Evaluated at bid price : 15.40
Bid-YTW : 7.91 %
W.PR.J Perpetual-Discount 1.94 % YTW SCENARIO
Maturity Type : Limit Maturity
Maturity Date : 2039-06-05
Maturity Price : 21.31
Evaluated at bid price : 21.58
Bid-YTW : 6.60 %
BAM.PR.M Perpetual-Discount 2.24 % YTW SCENARIO
Maturity Type : Limit Maturity
Maturity Date : 2039-06-05
Maturity Price : 15.51
Evaluated at bid price : 15.51
Bid-YTW : 7.85 %
Volume Highlights
Issue Index Shares
Traded
Notes
BAM.PR.P FixedReset 310,377 Recent new issue.
YTW SCENARIO
Maturity Type : Call
Maturity Date : 2019-10-30
Maturity Price : 25.00
Evaluated at bid price : 25.30
Bid-YTW : 6.77 %
MFC.PR.E FixedReset 127,738 Recent new issue.
YTW SCENARIO
Maturity Type : Call
Maturity Date : 2014-10-19
Maturity Price : 25.00
Evaluated at bid price : 25.16
Bid-YTW : 5.50 %
TD.PR.S FixedReset 116,694 Nesbitt crossed 98,900 at 25.05.
YTW SCENARIO
Maturity Type : Limit Maturity
Maturity Date : 2039-06-05
Maturity Price : 24.96
Evaluated at bid price : 25.01
Bid-YTW : 4.14 %
MFC.PR.D FixedReset 106,994 National crossed 80,000 at 26.80.
YTW SCENARIO
Maturity Type : Call
Maturity Date : 2014-07-19
Maturity Price : 25.00
Evaluated at bid price : 26.78
Bid-YTW : 5.00 %
RY.PR.D Perpetual-Discount 77,090 Nesbitt crossed 50,000 at 18.49.
YTW SCENARIO
Maturity Type : Limit Maturity
Maturity Date : 2039-06-05
Maturity Price : 18.45
Evaluated at bid price : 18.45
Bid-YTW : 6.16 %
BMO.PR.N FixedReset 65,380 Desjardins crossed 50,000 at 27.05.
YTW SCENARIO
Maturity Type : Call
Maturity Date : 2014-03-27
Maturity Price : 25.00
Evaluated at bid price : 27.10
Bid-YTW : 4.59 %
There were 40 other index-included issues trading in excess of 10,000 shares.
MAPF

Questions on MAPF and PrefLetter

I received a query today regarding the fund I offer, Malachite Aggressive Preferred Fund, and on PrefLetter, my monthly newsletter recommending preferred share issues of all classes to buy-and-hold retail investors.

A couple of quick questions as I consider your fund or letter:

– How do you balance the pref letter recommendations with with the buying/selling for the fund and any segregated accounts you control?

– Is there enough liquidity in the issues that you recommend or is there price movement soon after you issue the monthly letter?

Balancing Recommendations

PrefLetter is prepared after the close on the second Friday of each month according to the closing quotations and delivered to subscribers prior to the opening on the following Monday. The fact that the market is closed during the preparation of recommendations helps to reduce conflict between the two sets of duties.

Additionally, PrefLetter is oriented towards long term investment, while assets under management are more trading oriented. While there is necessarily a great deal of overlap between the two methods used to rank potential purchases, this overlap is not total. Briefly, PrefLetter is more yield oriented, while discretionary assets are more pricing-discrepency oriented.

Beyond that, I can only offer my integrity. When I do a job for somebody, I do the best job I can.

Sufficient Liquidity

It varies. The turnover in the issues recommended in PrefLetter is about 50% per issue; and those issues losing their status as top-of-the-list have rarely become unwise investments due to price movements or credit changes, they’ve just become less good than the issues chosen to replace them.

While some issues that are dropped might experience their change very shortly after publication, others just slowly drift off the list. Sometimes this is due to trades that other managers are executing on the market … if a manager wants to sell something and his dealer can’t find a counterparty with whom to cross the block, they will sometimes put in an iceberg order to execute it in pieces; that is, there may be a sell order of 100,000 shares entered with the exchange, but only 1,000 shares at a time will show on the board.

These icebergs are generally at attractive prices; the seller may know as well as I do that the issue is cheap to its comparables, but it doesn’t matter to him: he has to sell! Buyers at this attractive price are essentially selling him liquidity, charging him X cents for the service they are doing of taking it off his hands.

And when I make the recommendation, I have no way of knowing whether there ar 99,000 or 1,000 shares left in the total order: that’s the point of an iceberg!

Another technique seen recently is more labour intensive for the seller: there was an issue recommended recently for which there was, for practical purposes, no large offer on the board. However, whenever a limit bid was placed in excess of the seller’s price, he would hit that bid (this might have been an algorithmic trade).

In short, it depends on the vagaries of the market, but recommendations are reasonably stable and I provide alternatives where possible – similar issues from the same issuer – that increase the effective life of each recommendation.

Market Action

June 4, 2009

I noted yesterday that there had been a huge rally in junk bonds fuelled – at least in part – by issuer bids. The same thing is happening in asset-backeds:

European companies have increased purchases of their asset-backed bonds tenfold this year, taking advantage of prices that slumped 70 percent and signaling to investors that the worst of the recession may be over.

HSBC Holdings Plc, Europe’s biggest bank, is offering to buy as much as 4 billion pounds ($6.5 billion) of its notes secured by company loans. Canary Wharf Group Plc bought 119.8 million pounds of debt backed by offices in London’s second financial district in April.

All told, more than $1.8 billion of the debt was repurchased through public auctions this year by banks, real estate companies and the owner of the Greene King pub chain, according to data compiled by Bloomberg. That’s up from $164 million in all of 2008.

The Bank of Canada kept the overnight rate at 25bp:

Information received since the Bank’s April Monetary Policy Report (MPR) is broadly consistent with the Bank’s medium-term outlook for output and inflation in Canada. The economy is undergoing major restructuring in a number of sectors. The already significant output gap will continue to widen through the third quarter, putting downward pressure on inflation. The Bank continues to expect that the global and Canadian recoveries will be more muted than usual.

In recent weeks, financial conditions and commodity prices have improved significantly, and consumer and business confidence have recovered modestly. If the unprecedentedly rapid rise in the Canadian dollar (which reflects a combination of higher commodity prices and generalized weakness in the U.S. currency) proves persistent, it could fully offset these positive factors.

The outlook is subject to considerable uncertainty. While the underlying macroeconomic risks are roughly balanced, the Bank judges that, as a consequence of operating at the effective lower bound, the overall risks to its inflation projection remain tilted slightly to the downside.

Conditional on the outlook for inflation, the target overnight rate can be expected to remain at its current level until the end of the second quarter of 2010 in order to achieve the inflation target.

After today’s gains, PerpetualDiscounts now yield 6.31%, equivalent to 8.83% interest at the standard equivalency factor of 1.4x. With all these gains they still lagged long corporates, which now yield 6.7%, so the pre-tax interest-equivalent spread is now about 213bp.

HIMIPref™ Preferred Indices
These values reflect the December 2008 revision of the HIMIPref™ Indices

Values are provisional and are finalized monthly
Index Mean
Current
Yield
(at bid)
Median
YTW
Median
Average
Trading
Value
Median
Mod Dur
(YTW)
Issues Day’s Perf. Index Value
Ratchet 0.00 % 0.00 % 0 0.00 0 0.1959 % 1,306.1
FixedFloater 7.20 % 5.73 % 30,157 15.97 1 0.2656 % 2,094.7
Floater 2.89 % 3.33 % 80,071 18.85 3 0.1959 % 1,631.7
OpRet 5.00 % 3.78 % 142,126 2.55 14 0.2105 % 2,172.3
SplitShare 5.94 % 6.38 % 53,973 4.26 3 -0.4495 % 1,837.1
Interest-Bearing 6.00 % 7.53 % 26,210 0.55 1 0.0000 % 1,987.2
Perpetual-Premium 0.00 % 0.00 % 0 0.00 0 0.1706 % 1,729.2
Perpetual-Discount 6.35 % 6.31 % 163,433 13.49 71 0.1706 % 1,592.5
FixedReset 5.72 % 4.74 % 596,171 4.43 39 0.3263 % 1,997.5
Performance Highlights
Issue Index Change Notes
CIU.PR.A Perpetual-Discount -1.78 % YTW SCENARIO
Maturity Type : Limit Maturity
Maturity Date : 2039-06-04
Maturity Price : 18.71
Evaluated at bid price : 18.71
Bid-YTW : 6.20 %
BNA.PR.C SplitShare -1.71 % Asset coverage of 1.9-:1 as of May 31 according to the company.
YTW SCENARIO
Maturity Type : Hard Maturity
Maturity Date : 2019-01-10
Maturity Price : 25.00
Evaluated at bid price : 14.40
Bid-YTW : 11.95 %
BAM.PR.B Floater -1.58 % YTW SCENARIO
Maturity Type : Limit Maturity
Maturity Date : 2039-06-04
Maturity Price : 11.81
Evaluated at bid price : 11.81
Bid-YTW : 3.37 %
RY.PR.H Perpetual-Discount -1.16 % YTW SCENARIO
Maturity Type : Limit Maturity
Maturity Date : 2039-06-04
Maturity Price : 22.93
Evaluated at bid price : 23.08
Bid-YTW : 6.17 %
ELF.PR.F Perpetual-Discount -1.12 % YTW SCENARIO
Maturity Type : Limit Maturity
Maturity Date : 2039-06-04
Maturity Price : 18.50
Evaluated at bid price : 18.50
Bid-YTW : 7.31 %
NA.PR.P FixedReset 1.04 % YTW SCENARIO
Maturity Type : Call
Maturity Date : 2014-03-17
Maturity Price : 25.00
Evaluated at bid price : 27.25
Bid-YTW : 4.62 %
BAM.PR.O OpRet 1.04 % YTW SCENARIO
Maturity Type : Option Certainty
Maturity Date : 2013-06-30
Maturity Price : 25.00
Evaluated at bid price : 23.25
Bid-YTW : 7.32 %
MFC.PR.C Perpetual-Discount 1.07 % YTW SCENARIO
Maturity Type : Limit Maturity
Maturity Date : 2039-06-04
Maturity Price : 17.91
Evaluated at bid price : 17.91
Bid-YTW : 6.31 %
CM.PR.J Perpetual-Discount 1.11 % YTW SCENARIO
Maturity Type : Limit Maturity
Maturity Date : 2039-06-04
Maturity Price : 18.21
Evaluated at bid price : 18.21
Bid-YTW : 6.27 %
BNS.PR.K Perpetual-Discount 1.12 % YTW SCENARIO
Maturity Type : Limit Maturity
Maturity Date : 2039-06-04
Maturity Price : 19.88
Evaluated at bid price : 19.88
Bid-YTW : 6.13 %
BAM.PR.I OpRet 1.18 % YTW SCENARIO
Maturity Type : Soft Maturity
Maturity Date : 2013-12-30
Maturity Price : 25.00
Evaluated at bid price : 24.03
Bid-YTW : 6.80 %
CM.PR.P Perpetual-Discount 1.40 % YTW SCENARIO
Maturity Type : Limit Maturity
Maturity Date : 2039-06-04
Maturity Price : 21.80
Evaluated at bid price : 21.80
Bid-YTW : 6.40 %
NA.PR.O FixedReset 1.41 % YTW SCENARIO
Maturity Type : Call
Maturity Date : 2014-03-17
Maturity Price : 25.00
Evaluated at bid price : 27.26
Bid-YTW : 4.60 %
HSB.PR.C Perpetual-Discount 1.49 % YTW SCENARIO
Maturity Type : Limit Maturity
Maturity Date : 2039-06-04
Maturity Price : 20.40
Evaluated at bid price : 20.40
Bid-YTW : 6.38 %
BMO.PR.H Perpetual-Discount 2.16 % YTW SCENARIO
Maturity Type : Limit Maturity
Maturity Date : 2039-06-04
Maturity Price : 21.84
Evaluated at bid price : 22.20
Bid-YTW : 6.00 %
BAM.PR.K Floater 2.49 % YTW SCENARIO
Maturity Type : Limit Maturity
Maturity Date : 2039-06-04
Maturity Price : 11.95
Evaluated at bid price : 11.95
Bid-YTW : 3.33 %
Volume Highlights
Issue Index Shares
Traded
Notes
BAM.PR.P FixedReset 947,772 New issue settled today.
YTW SCENARIO
Maturity Type : Limit Maturity
Maturity Date : 2039-06-04
Maturity Price : 25.20
Evaluated at bid price : 25.25
Bid-YTW : 6.78 %
MFC.PR.E FixedReset 237,792 Recent new issue.
YTW SCENARIO
Maturity Type : Call
Maturity Date : 2019-10-19
Maturity Price : 25.00
Evaluated at bid price : 25.14
Bid-YTW : 5.51 %
MFC.PR.A OpRet 141,413 RBC crossed blocks of 90,000 and 25,000 and 10,000 shares, all at 24.90.
YTW SCENARIO
Maturity Type : Soft Maturity
Maturity Date : 2015-12-18
Maturity Price : 25.00
Evaluated at bid price : 24.89
Bid-YTW : 4.17 %
MFC.PR.C Perpetual-Discount 65,220 Nesbitt crossed 50,000 shares at 17.90.
YTW SCENARIO
Maturity Type : Limit Maturity
Maturity Date : 2039-06-04
Maturity Price : 17.91
Evaluated at bid price : 17.91
Bid-YTW : 6.31 %
HSB.PR.D Perpetual-Discount 55,650 Nesbitt crossed 49,500 at 19.95.
YTW SCENARIO
Maturity Type : Limit Maturity
Maturity Date : 2039-06-04
Maturity Price : 19.81
Evaluated at bid price : 19.81
Bid-YTW : 6.44 %
BMO.PR.O FixedReset 40,215 YTW SCENARIO
Maturity Type : Call
Maturity Date : 2014-06-24
Maturity Price : 25.00
Evaluated at bid price : 27.06
Bid-YTW : 5.00 %
There were 50 other index-included issues trading in excess of 10,000 shares.
Issue Comments

BAM.PR.P Ascends to Solid Premium on Heavy Volume

BAM.PR.P, the Brookfield Asset Management FixedReset 7.00%+445 announced on May 27, has commenced trading.

The issue traded 947,772 shares in a range of 25.05-30 before closing at 25.25-28, 9×19.

Vital statistics are:

BAM.PR.P FixedReset YTW SCENARIO
Maturity Type : Limit Maturity
Maturity Date : 2039-06-04
Maturity Price : 25.20
Evaluated at bid price : 25.25
Bid-YTW : 6.78 %

BAM.PR.P has been added to the HIMIPref™ FixedReset subindex.

It is of interest that Brookfield issued CAD 500-million in five-year notes almost simultaneously with this issue. The debentures carry a coupon of 8.95%, with the following highlighted in the prospectus:

We may redeem some or all of the notes at any time at 100% of the principal amount plus a make-whole premium. We will be required to make an offer to purchase the notes at a price equal to 101% of their principal amount, plus accrued and unpaid interest to the date of repurchase upon the occurrence of a Change of Control Triggering Event (as defined herein).

The “make-whole” provision is simply a Canada call at +162bp. The Change of Control Triggering Event means not just a change in control, but also a downgrade of the debs to below investment grade by three out of the four main rating agencies.

Issue Comments

KSP.UN Downgraded to P-4(low) by S&P; DBRS downgrades asset

DBRS has announced that it:

has today downgraded the long-term debt ratings of Kingsway Financial Services Inc. (Kingsway or the Company) and its U.S. holding company, Kingsway America Inc., to BB (low) from BBB (low). The ratings remain Under Review with Negative Implications, where they were placed on February 9, 2009.

There has not, as yet, been a change announced in their rating of KSP.UN, a structured preferred-ha-ha ultimately dependent upon the credit of Kingsway Financial Services.

KSP.UN was downgraded on May 13 by S&P to B- / P-4(low).

KSP.UN was last mentioned on PrefBlog when DBRS placed it under review-negative. KSP.UN is not tracked by HIMIPref™.

Market Action

June 3, 2009

The recent rally in junk bonds is having some interesting knock-on effects:

The biggest high-yield rally ever is punishing the lowest- rated companies that may no longer be able to afford avoiding bankruptcy by exchanging or buying back debt at the lowest prices on record. The “cruel irony” of rising prices means the neediest businesses will have a harder time finding financing, Morgan Stanley analysts led by Jocelyn Chu in New York said in a May 15 report. That may lead to more defaults than anticipated.

Freescale Semiconductor Inc., part-owned by 62-year-old Schwarzman’s Blackstone Group LP, wiped away $1.9 billion of debt in March by giving investors an average of 32 cents on the dollar in loans. Since the bond exchange was announced March 4, the securities have tripled to as high as 54.1 cents on the dollar, curtailing the chipmaker’s ability to cut the rest of its $7.5 billion debt load.

C-EBS is hosting a public hearing on liquidity buffers, in an attempt to finalize a framework for EU national bank supervision. There is a a wide range of industry practices:

– Within the industry, most banks either formally define a liquidity buffer or alternatively it is a concept implicit in their liquidity management policy.

– One institution formally defines its liquidity buffer as highly liquid unencumbered assets set at a level to get through the initial stages of a liquidity shock. It also defines a maximum amount of collateral that may be needed for intraday payment system purposes and deducts this from the stock of unencumbered assets. Buffers are formed for each of the currencies in which it is active. A survival period of 90 days is defined and liquidity shock scenarios developed to calibrate the size of the buffer.

– Another bank defines the buffer as a liquidity gap based on a runoff scenario (all maturing assets and liabilities not renewed during a 4 week period) that can be covered from high quality funding sources.

– Another bank defines the buffer over 30 days but does not use stress tests to measure the required size of buffer. Instead, expert judgement from the ALCO sets the buffer level. The quality of the assets in the buffer also impacts the level of buffer held.

– Another bank does not formally define a buffer. Instead it manages its overall counterbalancing capacity. As part of this, it uses projected flows to estimate a level of unencumbered assets that will cover the liquidity gap such that no change to the bank’s business model is required. This output is an input to the overall policy on managing its counterbalancing capacity.

The Globe and Mail has a story on Property & Casualty insurers:

The Office of the Superintendent of Financial Institutions (OSFI), which regulates about 200 companies in the sector, is worried about capital levels in the industry.

“It’s a period of great uncertainty right now,” said Bruce Thompson, a director in the supervision sector of OSFI’s Toronto office. “Our expectation is that 2009 is going to be a difficult year for the industry.”

Its total capital level dropped last year for the first time since 2003. The key measure of a property and casualty insurer’s financial cushion is called the Minimum Capital Test. The sector-wide ratio fell to 238 per cent at the end of 2008, from 252 per cent at the end of 2007. (Regulators require it to remain above a floor of 150 per cent, but Mr. Thompson pointed out that “companies know darn well that 150 is a territory you don’t go.”)

A basically flat day for preferreds amidst continued heavy volume.

HIMIPref™ Preferred Indices
These values reflect the December 2008 revision of the HIMIPref™ Indices

Values are provisional and are finalized monthly
Index Mean
Current
Yield
(at bid)
Median
YTW
Median
Average
Trading
Value
Median
Mod Dur
(YTW)
Issues Day’s Perf. Index Value
Ratchet 0.00 % 0.00 % 0 0.00 0 0.1717 % 1,303.5
FixedFloater 7.22 % 5.76 % 30,426 15.93 1 -0.9211 % 2,089.1
Floater 2.89 % 3.31 % 78,447 18.89 3 0.1717 % 1,628.5
OpRet 5.01 % 3.89 % 144,274 2.56 14 0.0313 % 2,167.7
SplitShare 5.91 % 5.10 % 52,663 4.26 3 0.2486 % 1,845.4
Interest-Bearing 6.00 % 7.49 % 26,431 0.56 1 0.0000 % 1,987.2
Perpetual-Premium 0.00 % 0.00 % 0 0.00 0 -0.0241 % 1,726.2
Perpetual-Discount 6.36 % 6.38 % 162,051 13.41 71 -0.0241 % 1,589.8
FixedReset 5.70 % 4.91 % 602,319 4.42 38 0.0425 % 1,991.0
Performance Highlights
Issue Index Change Notes
BAM.PR.I OpRet -1.66 % YTW SCENARIO
Maturity Type : Soft Maturity
Maturity Date : 2013-12-30
Maturity Price : 25.00
Evaluated at bid price : 23.75
Bid-YTW : 7.09 %
W.PR.J Perpetual-Discount -1.35 % YTW SCENARIO
Maturity Type : Limit Maturity
Maturity Date : 2039-06-03
Maturity Price : 21.20
Evaluated at bid price : 21.20
Bid-YTW : 6.73 %
PWF.PR.E Perpetual-Discount -1.31 % YTW SCENARIO
Maturity Type : Limit Maturity
Maturity Date : 2039-06-03
Maturity Price : 21.08
Evaluated at bid price : 21.08
Bid-YTW : 6.62 %
RY.PR.A Perpetual-Discount -1.13 % YTW SCENARIO
Maturity Type : Limit Maturity
Maturity Date : 2039-06-03
Maturity Price : 18.33
Evaluated at bid price : 18.33
Bid-YTW : 6.13 %
RY.PR.H Perpetual-Discount 1.13 % YTW SCENARIO
Maturity Type : Limit Maturity
Maturity Date : 2039-06-03
Maturity Price : 23.19
Evaluated at bid price : 23.35
Bid-YTW : 6.10 %
RY.PR.W Perpetual-Discount 1.26 % YTW SCENARIO
Maturity Type : Limit Maturity
Maturity Date : 2039-06-03
Maturity Price : 20.11
Evaluated at bid price : 20.11
Bid-YTW : 6.15 %
BAM.PR.B Floater 1.27 % YTW SCENARIO
Maturity Type : Limit Maturity
Maturity Date : 2039-06-03
Maturity Price : 12.00
Evaluated at bid price : 12.00
Bid-YTW : 3.31 %
CU.PR.B Perpetual-Discount 1.64 % YTW SCENARIO
Maturity Type : Limit Maturity
Maturity Date : 2039-06-03
Maturity Price : 24.50
Evaluated at bid price : 24.80
Bid-YTW : 6.08 %
CM.PR.R OpRet 1.86 % YTW SCENARIO
Maturity Type : Call
Maturity Date : 2009-07-03
Maturity Price : 25.60
Evaluated at bid price : 26.23
Bid-YTW : -18.42 %
Volume Highlights
Issue Index Shares
Traded
Notes
MFC.PR.E FixedReset 1,144,632 New issue settled today.
YTW SCENARIO
Maturity Type : Limit Maturity
Maturity Date : 2039-06-03
Maturity Price : 25.00
Evaluated at bid price : 25.05
Bid-YTW : 5.53 %
CM.PR.K FixedReset 127,965 RBC crossed 92,100 at 25.10.
YTW SCENARIO
Maturity Type : Limit Maturity
Maturity Date : 2039-06-03
Maturity Price : 25.00
Evaluated at bid price : 25.05
Bid-YTW : 4.73 %
BMO.PR.O FixedReset 113,970 National crossed 15,000 at 26.95; Desjardins crossed blocks of 50,000 and 25,000 shares, both at 27.00.
YTW SCENARIO
Maturity Type : Call
Maturity Date : 2014-06-24
Maturity Price : 25.00
Evaluated at bid price : 26.99
Bid-YTW : 5.05 %
CM.PR.R OpRet 104,700 RBC crossed 100,000 at 25.85.
YTW SCENARIO
Maturity Type : Call
Maturity Date : 2009-07-03
Maturity Price : 25.60
Evaluated at bid price : 26.23
Bid-YTW : -18.42 %
GWO.PR.X OpRet 59,677 Dundee bought 56,000 from TD at 25.75.
YTW SCENARIO
Maturity Type : Soft Maturity
Maturity Date : 2013-09-29
Maturity Price : 25.00
Evaluated at bid price : 25.56
Bid-YTW : 4.16 %
SLF.PR.F FixedReset 46,985 YTW SCENARIO
Maturity Type : Call
Maturity Date : 2014-07-30
Maturity Price : 25.00
Evaluated at bid price : 25.76
Bid-YTW : 5.41 %
There were 41 other index-included issues trading in excess of 10,000 shares.
Issue Comments

MFC.PR.E Settles above Par on Very Heavy Volume

MFC.PR.E, the FixedReset 5.60%+323 issue announced last week, settled today.

It traded 1,143,332 shares in a range of 25.00-14 before closing at 25.05-09, 30×48.

Vital statistics are:

MFC.PR.E FixedReset YTW SCENARIO
Maturity Type : Limit Maturity
Maturity Date : 2039-06-03
Maturity Price : 25.00
Evaluated at bid price : 25.05
Bid-YTW : 5.53 %

MFC.PR.E has been added to the HIMIPref™ FixedReset subindex.

Interesting External Papers

Yield Spreads & Default Risk

The Anginer and Yıldızhan paper recently discussed on PrefBlog that attempted to corellate credit spreads with equity returns referenced a paper by Jing-zhi Huang and Ming Huang titled How Much of Corporate-Treasury Yield Spread is Due to Credit Risk?: A New Calibration, presented at the 14th Annual Conference on Financial Economics and Accounting:

No consensus has yet emerged from the existing credit risk literature on how much of the observed corporate-Treasury yield spreads can be explained by credit risk. In this paper, we propose a new calibration approach based on historical default data and show that one can indeed obtain consistent estimate of the credit spread across many different economic considerations within the structural framework of credit risk valuation. We find that credit risk accounts for only a small fraction of the observed corporate-Treasury yield spreads for investment grade bonds of all maturities, with the fraction smaller for bonds of shorter maturities; and that it accounts for a much higher fraction of yield spreads for junk bonds. We obtain these results by calibrating each of the models – both existing and new ones – to be consistent with data on historical default loss experience. Different structural models, which in theory can still generate a very large range of credit spreads, are shown to predict fairly similar credit spreads under empirically reasonable parameter choices, resulting in the robustness of our conclusion.

They note:

One common finding from these studies is that the average historical default loss rate for corporate bonds is typically much smaller than the observed corporate-Treasury yield spreads, and is only a small fraction of the yield spreads for investment-grade bonds. Figure 1 provides a visual summary of this finding.


Click for big

They point out:

This fact alone, however, should not lead one to automatically conclude that credit risk accounts for only a small fraction of the observed yield spreads for investment grade bonds. After all, the expected default loss rate is only part of the (promised) credit yield spread; the other part is the credit risk premium, defined as the difference between the expected realized return of a defaultable bond and that of a comparable Treasury bond. The credit risk premium is required by investors because the uncertainty of default loss should be systematic—bondholders are more likely to suffer default losses in bad states of the economy. Moreover, precisely because of the tendency for default events to cluster in the worst states of the economy, the credit risk premium can be potentially very large. In fact, some of the models considered in this paper can indeed generate credit risk premia that are large enough to explain the difference between the observed corporate yield spreads and historical default loss rate, provided that certain parameter choices are made. The key question, however, is whether any model can generate such large credit risk premia under empirically reasonable parameter choices. This question is the main focus of our paper.

They conclude:

We conclude that, for investment grade bonds (those with a credit rating not lower than Baa) of all maturities, credit risk accounts for only a small fraction—typically around 20%, and, for Baa-rated bonds, in the 30% range—of the observed corporate-Treasury yield spreads, and it accounts for a smaller fraction of the observed spreads for bonds of shorter maturities. For junk bonds, however, credit risk accounts for a much larger fraction of the observed corporate-Treasury yield spreads.