Month: August 2025

Market Action

August 7, 2025

Today’s Survey of Consumer Expectations shows assertions of slowing inflation are not universally accepted:

July Survey: Inflation Expectations Up at Short- and Longer-Term Horizons, Unchanged at Medium-Term

Median inflation expectations increased to 3.1 percent from 3.0 percent at the one-year-ahead horizon and to 2.9 percent from 2.6 percent at the five-year-ahead horizon. Expectations remained steady at 3.0 percent at the three-year-ahead horizon.

Households’ perceptions about their current financial situation compared to a year ago and expectations about their year-ahead financial situation both improved. Smaller shares of respondents reported that their households are worse off than a year ago or are expecting to be worse off a year from now.

The mean expected probability that the U.S. unemployment rate will be higher one year from now dropped 2.3 percentage points (ppt) to 37.4 percent, the lowest reading since January 2025. However, the mean perceived probability of losing one’s job in the next twelve months increased by 0.4 ppt to 14.4 percent.

Perceptions of credit access compared to a year ago deteriorated slightly, with the net share of households reporting that it is easier versus harder to get credit decreasing. Conversely, expectations for future credit availability improved, with the net share of respondents expecting it to be easier versus harder to obtain credit a year from now increasing slightly.

For more details:
Press Release: Inflation Expectations Tick Up; Consumers More Optimistic about Taxes and Their Financial Situations

HIMIPref™ Preferred Indices
These values reflect the December 2008 revision of the HIMIPref™ Indices

Values are provisional and are finalized monthly
Index Mean
Current
Yield
(at bid)
Median
YTW
Median
Average
Trading
Value
Median
Mod Dur
(YTW)
Issues Day’s Perf. Index Value
Ratchet 6.92 % 7.37 % 35,841 13.06 1 -0.3115 % 2,391.0
FixedFloater 0.00 % 0.00 % 0 0.00 0 -0.2029 % 4,599.7
Floater 6.61 % 6.90 % 42,093 12.64 3 -0.2029 % 2,650.8
OpRet 0.00 % 0.00 % 0 0.00 0 -0.1232 % 3,682.3
SplitShare 4.75 % 4.23 % 48,844 2.40 7 -0.1232 % 4,397.4
Interest-Bearing 0.00 % 0.00 % 0 0.00 0 -0.1232 % 3,431.0
Perpetual-Premium 5.83 % -2.43 % 115,218 0.08 2 0.1596 % 3,058.7
Perpetual-Discount 5.61 % 5.74 % 43,436 14.27 30 -0.1724 % 3,335.5
FixedReset Disc 5.62 % 6.18 % 115,318 13.30 37 -0.6049 % 3,023.0
Insurance Straight 5.50 % 5.61 % 61,177 14.45 18 1.3491 % 3,285.5
FloatingReset 5.28 % 5.33 % 35,978 14.88 1 0.0808 % 3,735.6
FixedReset Prem 5.88 % 5.05 % 116,055 2.55 17 -0.2253 % 2,629.4
FixedReset Bank Non 0.00 % 0.00 % 0 0.00 0 -0.6049 % 3,090.1
FixedReset Ins Non 5.31 % 5.62 % 72,376 14.18 15 -1.6716 % 3,015.8
Performance Highlights
Issue Index Change Notes
GWO.PR.N FixedReset Ins Non -15.98 % YTW SCENARIO
Maturity Type : Limit Maturity
Maturity Date : 2055-08-07
Maturity Price : 15.46
Evaluated at bid price : 15.46
Bid-YTW : 6.81 %
MFC.PR.Q FixedReset Ins Non -9.45 % YTW SCENARIO
Maturity Type : Limit Maturity
Maturity Date : 2055-08-07
Maturity Price : 22.45
Evaluated at bid price : 23.00
Bid-YTW : 6.14 %
BN.PR.T FixedReset Disc -9.14 % YTW SCENARIO
Maturity Type : Limit Maturity
Maturity Date : 2055-08-07
Maturity Price : 18.30
Evaluated at bid price : 18.30
Bid-YTW : 7.04 %
BN.PR.R FixedReset Disc -6.10 % YTW SCENARIO
Maturity Type : Limit Maturity
Maturity Date : 2055-08-07
Maturity Price : 19.10
Evaluated at bid price : 19.10
Bid-YTW : 6.77 %
SLF.PR.G FixedReset Ins Non -3.23 % YTW SCENARIO
Maturity Type : Limit Maturity
Maturity Date : 2055-08-07
Maturity Price : 18.00
Evaluated at bid price : 18.00
Bid-YTW : 6.08 %
FTS.PR.M FixedReset Disc -2.80 % YTW SCENARIO
Maturity Type : Limit Maturity
Maturity Date : 2055-08-07
Maturity Price : 22.48
Evaluated at bid price : 23.30
Bid-YTW : 5.91 %
BN.PF.E FixedReset Disc -2.06 % YTW SCENARIO
Maturity Type : Limit Maturity
Maturity Date : 2055-08-07
Maturity Price : 21.35
Evaluated at bid price : 21.35
Bid-YTW : 6.42 %
MFC.PR.F FixedReset Ins Non -1.80 % YTW SCENARIO
Maturity Type : Limit Maturity
Maturity Date : 2055-08-07
Maturity Price : 18.00
Evaluated at bid price : 18.00
Bid-YTW : 5.95 %
BN.PF.F FixedReset Disc -1.63 % YTW SCENARIO
Maturity Type : Limit Maturity
Maturity Date : 2055-08-07
Maturity Price : 22.28
Evaluated at bid price : 22.92
Bid-YTW : 6.40 %
ENB.PR.J FixedReset Disc -1.32 % YTW SCENARIO
Maturity Type : Limit Maturity
Maturity Date : 2055-08-07
Maturity Price : 21.98
Evaluated at bid price : 22.37
Bid-YTW : 6.41 %
TD.PF.I FixedReset Prem -1.03 % YTW SCENARIO
Maturity Type : Call
Maturity Date : 2027-10-31
Maturity Price : 25.00
Evaluated at bid price : 26.00
Bid-YTW : 4.49 %
NA.PR.G FixedReset Prem -1.01 % YTW SCENARIO
Maturity Type : Call
Maturity Date : 2028-11-16
Maturity Price : 25.00
Evaluated at bid price : 26.39
Bid-YTW : 5.17 %
NA.PR.C FixedReset Prem -1.00 % YTW SCENARIO
Maturity Type : Call
Maturity Date : 2027-11-15
Maturity Price : 25.00
Evaluated at bid price : 26.60
Bid-YTW : 4.01 %
RY.PR.S FixedReset Prem 1.07 % YTW SCENARIO
Maturity Type : Call
Maturity Date : 2029-02-24
Maturity Price : 25.00
Evaluated at bid price : 26.35
Bid-YTW : 4.17 %
GWO.PR.P Insurance Straight 1.13 % YTW SCENARIO
Maturity Type : Limit Maturity
Maturity Date : 2055-08-07
Maturity Price : 23.97
Evaluated at bid price : 24.22
Bid-YTW : 5.64 %
GWO.PR.Q Insurance Straight 1.20 % YTW SCENARIO
Maturity Type : Limit Maturity
Maturity Date : 2055-08-07
Maturity Price : 22.49
Evaluated at bid price : 22.75
Bid-YTW : 5.73 %
MFC.PR.C Insurance Straight 1.23 % YTW SCENARIO
Maturity Type : Limit Maturity
Maturity Date : 2055-08-07
Maturity Price : 21.45
Evaluated at bid price : 21.45
Bid-YTW : 5.33 %
IFC.PR.C FixedReset Ins Non 1.28 % YTW SCENARIO
Maturity Type : Limit Maturity
Maturity Date : 2055-08-07
Maturity Price : 23.14
Evaluated at bid price : 23.65
Bid-YTW : 5.78 %
SLF.PR.C Insurance Straight 1.69 % YTW SCENARIO
Maturity Type : Limit Maturity
Maturity Date : 2055-08-07
Maturity Price : 21.42
Evaluated at bid price : 21.68
Bid-YTW : 5.18 %
GWO.PR.G Insurance Straight 3.50 % YTW SCENARIO
Maturity Type : Limit Maturity
Maturity Date : 2055-08-07
Maturity Price : 22.80
Evaluated at bid price : 23.08
Bid-YTW : 5.70 %
MFC.PR.B Insurance Straight 4.60 % YTW SCENARIO
Maturity Type : Limit Maturity
Maturity Date : 2055-08-07
Maturity Price : 21.33
Evaluated at bid price : 21.60
Bid-YTW : 5.45 %
GWO.PR.H Insurance Straight 9.65 % YTW SCENARIO
Maturity Type : Limit Maturity
Maturity Date : 2055-08-07
Maturity Price : 21.80
Evaluated at bid price : 22.04
Bid-YTW : 5.56 %
Volume Highlights
Issue Index Shares
Traded
Notes
BN.PF.G FixedReset Disc 88,000 YTW SCENARIO
Maturity Type : Limit Maturity
Maturity Date : 2055-08-07
Maturity Price : 22.25
Evaluated at bid price : 22.95
Bid-YTW : 6.32 %
GWO.PR.P Insurance Straight 42,024 YTW SCENARIO
Maturity Type : Limit Maturity
Maturity Date : 2055-08-07
Maturity Price : 23.97
Evaluated at bid price : 24.22
Bid-YTW : 5.64 %
MFC.PR.B Insurance Straight 40,446 YTW SCENARIO
Maturity Type : Limit Maturity
Maturity Date : 2055-08-07
Maturity Price : 21.33
Evaluated at bid price : 21.60
Bid-YTW : 5.45 %
CM.PR.S FixedReset Prem 34,600 YTW SCENARIO
Maturity Type : Limit Maturity
Maturity Date : 2055-08-07
Maturity Price : 25.70
Evaluated at bid price : 25.70
Bid-YTW : 5.36 %
SLF.PR.E Insurance Straight 27,164 YTW SCENARIO
Maturity Type : Limit Maturity
Maturity Date : 2055-08-07
Maturity Price : 21.45
Evaluated at bid price : 21.45
Bid-YTW : 5.32 %
PWF.PR.Z Perpetual-Discount 26,508 YTW SCENARIO
Maturity Type : Limit Maturity
Maturity Date : 2055-08-07
Maturity Price : 22.09
Evaluated at bid price : 22.44
Bid-YTW : 5.77 %
There were 8 other index-included issues trading in excess of 10,000 shares.
Wide Spread Highlights
See TMX DataLinx: ‘Last’ != ‘Close’ and the posts linked therein for an idea of why these quotes are so horrible.
Issue Index Quote Data and Yield Notes
GWO.PR.N FixedReset Ins Non Quote: 15.46 – 18.49
Spot Rate : 3.0300
Average : 1.6303

YTW SCENARIO
Maturity Type : Limit Maturity
Maturity Date : 2055-08-07
Maturity Price : 15.46
Evaluated at bid price : 15.46
Bid-YTW : 6.81 %

MFC.PR.Q FixedReset Ins Non Quote: 23.00 – 25.50
Spot Rate : 2.5000
Average : 1.3943

YTW SCENARIO
Maturity Type : Limit Maturity
Maturity Date : 2055-08-07
Maturity Price : 22.45
Evaluated at bid price : 23.00
Bid-YTW : 6.14 %

BN.PR.T FixedReset Disc Quote: 18.30 – 20.32
Spot Rate : 2.0200
Average : 1.1461

YTW SCENARIO
Maturity Type : Limit Maturity
Maturity Date : 2055-08-07
Maturity Price : 18.30
Evaluated at bid price : 18.30
Bid-YTW : 7.04 %

IFC.PR.G FixedReset Ins Non Quote: 25.10 – 26.10
Spot Rate : 1.0000
Average : 0.6175

YTW SCENARIO
Maturity Type : Limit Maturity
Maturity Date : 2055-08-07
Maturity Price : 23.43
Evaluated at bid price : 25.10
Bid-YTW : 5.55 %

BN.PR.R FixedReset Disc Quote: 19.10 – 20.62
Spot Rate : 1.5200
Average : 1.2834

YTW SCENARIO
Maturity Type : Limit Maturity
Maturity Date : 2055-08-07
Maturity Price : 19.10
Evaluated at bid price : 19.10
Bid-YTW : 6.77 %

FTS.PR.M FixedReset Disc Quote: 23.30 – 24.00
Spot Rate : 0.7000
Average : 0.4677

YTW SCENARIO
Maturity Type : Limit Maturity
Maturity Date : 2055-08-07
Maturity Price : 22.48
Evaluated at bid price : 23.30
Bid-YTW : 5.91 %

Market Action

August 6, 2025

PerpetualDiscounts now yield 5.74%, equivalent to 7.46% interest at the standard conversion factor of 1.3x. Long corporates now yield 4.89%, so the pre-tax interest-equivalent spread (in this context, the “Seniority Spread”) is now 255bp, unchanged from that reported July 30.

HIMIPref™ Preferred Indices
These values reflect the December 2008 revision of the HIMIPref™ Indices

Values are provisional and are finalized monthly
Index Mean
Current
Yield
(at bid)
Median
YTW
Median
Average
Trading
Value
Median
Mod Dur
(YTW)
Issues Day’s Perf. Index Value
Ratchet 6.90 % 7.35 % 36,313 13.08 1 1.5823 % 2,398.4
FixedFloater 0.00 % 0.00 % 0 0.00 0 0.2798 % 4,609.0
Floater 6.59 % 6.88 % 43,636 12.66 3 0.2798 % 2,656.2
OpRet 0.00 % 0.00 % 0 0.00 0 -0.0392 % 3,686.8
SplitShare 4.75 % 4.15 % 50,745 0.55 7 -0.0392 % 4,402.9
Interest-Bearing 0.00 % 0.00 % 0 0.00 0 -0.0392 % 3,435.3
Perpetual-Premium 5.84 % 1.23 % 116,842 0.08 2 0.0200 % 3,053.8
Perpetual-Discount 5.60 % 5.74 % 44,363 14.25 30 0.3564 % 3,341.3
FixedReset Disc 5.58 % 6.16 % 116,547 13.35 37 0.6481 % 3,041.4
Insurance Straight 5.57 % 5.68 % 57,494 14.35 18 0.7220 % 3,241.8
FloatingReset 5.28 % 5.34 % 36,345 14.87 1 0.2024 % 3,732.6
FixedReset Prem 5.87 % 4.95 % 115,172 2.55 17 -0.0182 % 2,635.4
FixedReset Bank Non 0.00 % 0.00 % 0 0.00 0 0.6481 % 3,108.9
FixedReset Ins Non 5.22 % 5.62 % 72,797 14.28 15 -0.3269 % 3,067.1
Performance Highlights
Issue Index Change Notes
MFC.PR.N FixedReset Ins Non -3.17 % YTW SCENARIO
Maturity Type : Limit Maturity
Maturity Date : 2055-08-06
Maturity Price : 22.43
Evaluated at bid price : 23.24
Bid-YTW : 5.66 %
IFC.PR.C FixedReset Ins Non -2.71 % YTW SCENARIO
Maturity Type : Limit Maturity
Maturity Date : 2055-08-06
Maturity Price : 22.84
Evaluated at bid price : 23.35
Bid-YTW : 5.86 %
RY.PR.S FixedReset Prem -1.44 % YTW SCENARIO
Maturity Type : Call
Maturity Date : 2029-02-24
Maturity Price : 25.00
Evaluated at bid price : 26.07
Bid-YTW : 4.50 %
BN.PF.B FixedReset Disc -1.28 % YTW SCENARIO
Maturity Type : Limit Maturity
Maturity Date : 2055-08-06
Maturity Price : 22.46
Evaluated at bid price : 23.15
Bid-YTW : 6.22 %
NA.PR.C FixedReset Prem 1.02 % YTW SCENARIO
Maturity Type : Call
Maturity Date : 2027-11-15
Maturity Price : 25.00
Evaluated at bid price : 26.87
Bid-YTW : 3.53 %
CU.PR.F Perpetual-Discount 1.02 % YTW SCENARIO
Maturity Type : Limit Maturity
Maturity Date : 2055-08-06
Maturity Price : 20.81
Evaluated at bid price : 20.81
Bid-YTW : 5.51 %
CIU.PR.A Perpetual-Discount 1.23 % YTW SCENARIO
Maturity Type : Limit Maturity
Maturity Date : 2055-08-06
Maturity Price : 20.50
Evaluated at bid price : 20.50
Bid-YTW : 5.72 %
CU.PR.E Perpetual-Discount 1.27 % YTW SCENARIO
Maturity Type : Limit Maturity
Maturity Date : 2055-08-06
Maturity Price : 22.06
Evaluated at bid price : 22.29
Bid-YTW : 5.59 %
PWF.PR.O Perpetual-Discount 1.30 % YTW SCENARIO
Maturity Type : Limit Maturity
Maturity Date : 2055-08-06
Maturity Price : 24.68
Evaluated at bid price : 24.99
Bid-YTW : 5.83 %
ENB.PR.J FixedReset Disc 1.34 % YTW SCENARIO
Maturity Type : Limit Maturity
Maturity Date : 2055-08-06
Maturity Price : 22.17
Evaluated at bid price : 22.67
Bid-YTW : 6.31 %
BN.PF.K Ratchet 1.58 % YTW SCENARIO
Maturity Type : Limit Maturity
Maturity Date : 2055-08-06
Maturity Price : 22.00
Evaluated at bid price : 16.05
Bid-YTW : 7.35 %
GWO.PR.P Insurance Straight 2.26 % YTW SCENARIO
Maturity Type : Limit Maturity
Maturity Date : 2055-08-06
Maturity Price : 23.68
Evaluated at bid price : 23.95
Bid-YTW : 5.70 %
BN.PR.N Perpetual-Discount 2.40 % YTW SCENARIO
Maturity Type : Limit Maturity
Maturity Date : 2055-08-06
Maturity Price : 20.94
Evaluated at bid price : 20.94
Bid-YTW : 5.75 %
SLF.PR.E Insurance Straight 3.13 % YTW SCENARIO
Maturity Type : Limit Maturity
Maturity Date : 2055-08-06
Maturity Price : 21.40
Evaluated at bid price : 21.40
Bid-YTW : 5.33 %
IFC.PR.I Insurance Straight 5.00 % YTW SCENARIO
Maturity Type : Limit Maturity
Maturity Date : 2055-08-06
Maturity Price : 23.67
Evaluated at bid price : 24.15
Bid-YTW : 5.64 %
BN.PR.R FixedReset Disc 6.49 % YTW SCENARIO
Maturity Type : Limit Maturity
Maturity Date : 2055-08-06
Maturity Price : 20.34
Evaluated at bid price : 20.34
Bid-YTW : 6.36 %
ENB.PR.H FixedReset Disc 7.62 % YTW SCENARIO
Maturity Type : Limit Maturity
Maturity Date : 2055-08-06
Maturity Price : 22.17
Evaluated at bid price : 22.60
Bid-YTW : 5.94 %
BIP.PR.F FixedReset Disc 9.17 % YTW SCENARIO
Maturity Type : Limit Maturity
Maturity Date : 2055-08-06
Maturity Price : 23.32
Evaluated at bid price : 25.00
Bid-YTW : 6.00 %
Volume Highlights
Issue Index Shares
Traded
Notes
BN.PF.H FixedReset Prem 225,200 YTW SCENARIO
Maturity Type : Call
Maturity Date : 2025-12-31
Maturity Price : 25.00
Evaluated at bid price : 25.18
Bid-YTW : 4.43 %
SLF.PR.G FixedReset Ins Non 123,600 YTW SCENARIO
Maturity Type : Limit Maturity
Maturity Date : 2055-08-06
Maturity Price : 18.60
Evaluated at bid price : 18.60
Bid-YTW : 5.88 %
ENB.PF.C FixedReset Disc 111,661 YTW SCENARIO
Maturity Type : Limit Maturity
Maturity Date : 2055-08-06
Maturity Price : 21.35
Evaluated at bid price : 21.35
Bid-YTW : 6.64 %
ENB.PF.G FixedReset Disc 52,730 YTW SCENARIO
Maturity Type : Limit Maturity
Maturity Date : 2055-08-06
Maturity Price : 21.56
Evaluated at bid price : 21.90
Bid-YTW : 6.48 %
BEP.PR.G FixedReset Ins Non 52,100 YTW SCENARIO
Maturity Type : Call
Maturity Date : 2026-01-31
Maturity Price : 25.00
Evaluated at bid price : 25.12
Bid-YTW : 4.67 %
CU.PR.I FixedReset Prem 50,612 YTW SCENARIO
Maturity Type : Call
Maturity Date : 2025-12-01
Maturity Price : 25.00
Evaluated at bid price : 25.35
Bid-YTW : 2.65 %
There were 16 other index-included issues trading in excess of 10,000 shares.
Wide Spread Highlights
See TMX DataLinx: ‘Last’ != ‘Close’ and the posts linked therein for an idea of why these quotes are so horrible.
Issue Index Quote Data and Yield Notes
BN.PF.E FixedReset Disc Quote: 21.80 – 25.00
Spot Rate : 3.2000
Average : 1.7703

YTW SCENARIO
Maturity Type : Limit Maturity
Maturity Date : 2055-08-06
Maturity Price : 21.51
Evaluated at bid price : 21.80
Bid-YTW : 6.27 %

ENB.PR.B FixedReset Disc Quote: 20.67 – 24.00
Spot Rate : 3.3300
Average : 1.9547

YTW SCENARIO
Maturity Type : Limit Maturity
Maturity Date : 2055-08-06
Maturity Price : 20.67
Evaluated at bid price : 20.67
Bid-YTW : 6.58 %

CU.PR.G Perpetual-Discount Quote: 20.69 – 22.30
Spot Rate : 1.6100
Average : 0.9983

YTW SCENARIO
Maturity Type : Limit Maturity
Maturity Date : 2055-08-06
Maturity Price : 20.69
Evaluated at bid price : 20.69
Bid-YTW : 5.54 %

IFC.PR.E Insurance Straight Quote: 23.94 – 24.99
Spot Rate : 1.0500
Average : 0.5941

YTW SCENARIO
Maturity Type : Limit Maturity
Maturity Date : 2055-08-06
Maturity Price : 23.65
Evaluated at bid price : 23.94
Bid-YTW : 5.49 %

GWO.PR.H Insurance Straight Quote: 20.10 – 22.38
Spot Rate : 2.2800
Average : 1.8395

YTW SCENARIO
Maturity Type : Limit Maturity
Maturity Date : 2055-08-06
Maturity Price : 20.10
Evaluated at bid price : 20.10
Bid-YTW : 6.12 %

BN.PR.Z FixedReset Disc Quote: 23.75 – 24.80
Spot Rate : 1.0500
Average : 0.6217

YTW SCENARIO
Maturity Type : Limit Maturity
Maturity Date : 2055-08-06
Maturity Price : 22.95
Evaluated at bid price : 23.75
Bid-YTW : 6.30 %

Market Action

August 5, 2025

HIMIPref™ Preferred Indices
These values reflect the December 2008 revision of the HIMIPref™ Indices

Values are provisional and are finalized monthly
Index Mean
Current
Yield
(at bid)
Median
YTW
Median
Average
Trading
Value
Median
Mod Dur
(YTW)
Issues Day’s Perf. Index Value
Ratchet 0.00 % 0.00 % 0 0.00 1 0.3318 % 2,361.1
FixedFloater 0.00 % 0.00 % 0 0.00 0 0.3318 % 4,596.2
Floater 6.61 % 6.88 % 43,454 12.67 3 0.3318 % 2,648.8
OpRet 0.00 % 0.00 % 0 0.00 0 0.2301 % 3,688.3
SplitShare 4.75 % 3.97 % 51,381 0.55 7 0.2301 % 4,404.6
Interest-Bearing 0.00 % 0.00 % 0 0.00 0 0.2301 % 3,436.6
Perpetual-Premium 0.00 % 0.00 % 0 0.00 2 0.3041 % 3,053.2
Perpetual-Discount 5.62 % 5.75 % 44,679 14.22 30 0.3041 % 3,329.4
FixedReset Disc 5.62 % 6.26 % 118,162 13.17 37 -0.0691 % 3,021.8
Insurance Straight 5.61 % 5.72 % 59,628 14.29 18 -1.0935 % 3,218.6
FloatingReset 5.29 % 5.35 % 37,622 14.86 1 0.3249 % 3,725.0
FixedReset Prem 5.87 % 4.84 % 112,319 2.56 17 0.2669 % 2,635.8
FixedReset Bank Non 0.00 % 0.00 % 0 0.00 0 -0.0691 % 3,088.9
FixedReset Ins Non 5.21 % 5.60 % 68,076 14.29 15 0.5585 % 3,077.1
Performance Highlights
Issue Index Change Notes
GWO.PR.H Insurance Straight -8.22 % YTW SCENARIO
Maturity Type : Limit Maturity
Maturity Date : 2055-08-05
Maturity Price : 20.10
Evaluated at bid price : 20.10
Bid-YTW : 6.12 %
BIP.PR.F FixedReset Disc -7.29 % YTW SCENARIO
Maturity Type : Limit Maturity
Maturity Date : 2055-08-05
Maturity Price : 22.33
Evaluated at bid price : 22.90
Bid-YTW : 6.62 %
ENB.PR.H FixedReset Disc -6.04 % YTW SCENARIO
Maturity Type : Limit Maturity
Maturity Date : 2055-08-05
Maturity Price : 21.00
Evaluated at bid price : 21.00
Bid-YTW : 6.43 %
MFC.PR.B Insurance Straight -4.04 % YTW SCENARIO
Maturity Type : Limit Maturity
Maturity Date : 2055-08-05
Maturity Price : 20.65
Evaluated at bid price : 20.65
Bid-YTW : 5.72 %
SLF.PR.E Insurance Straight -3.13 % YTW SCENARIO
Maturity Type : Limit Maturity
Maturity Date : 2055-08-05
Maturity Price : 20.75
Evaluated at bid price : 20.75
Bid-YTW : 5.49 %
GWO.PR.G Insurance Straight -2.71 % YTW SCENARIO
Maturity Type : Limit Maturity
Maturity Date : 2055-08-05
Maturity Price : 22.07
Evaluated at bid price : 22.30
Bid-YTW : 5.90 %
GWO.PR.P Insurance Straight -2.66 % YTW SCENARIO
Maturity Type : Limit Maturity
Maturity Date : 2055-08-05
Maturity Price : 23.16
Evaluated at bid price : 23.42
Bid-YTW : 5.83 %
CU.PR.H Perpetual-Discount -1.14 % YTW SCENARIO
Maturity Type : Limit Maturity
Maturity Date : 2055-08-05
Maturity Price : 23.17
Evaluated at bid price : 23.43
Bid-YTW : 5.70 %
IFC.PR.C FixedReset Ins Non 1.01 % YTW SCENARIO
Maturity Type : Limit Maturity
Maturity Date : 2055-08-05
Maturity Price : 23.50
Evaluated at bid price : 24.00
Bid-YTW : 5.70 %
ENB.PF.K FixedReset Disc 1.03 % YTW SCENARIO
Maturity Type : Limit Maturity
Maturity Date : 2055-08-05
Maturity Price : 23.25
Evaluated at bid price : 24.46
Bid-YTW : 6.34 %
BN.PF.B FixedReset Disc 1.03 % YTW SCENARIO
Maturity Type : Limit Maturity
Maturity Date : 2055-08-05
Maturity Price : 22.62
Evaluated at bid price : 23.45
Bid-YTW : 6.13 %
GWO.PR.Y Insurance Straight 1.15 % YTW SCENARIO
Maturity Type : Limit Maturity
Maturity Date : 2055-08-05
Maturity Price : 20.20
Evaluated at bid price : 20.20
Bid-YTW : 5.65 %
CU.PR.E Perpetual-Discount 1.20 % YTW SCENARIO
Maturity Type : Limit Maturity
Maturity Date : 2055-08-05
Maturity Price : 21.76
Evaluated at bid price : 22.01
Bid-YTW : 5.66 %
BIP.PR.B FixedReset Prem 1.28 % YTW SCENARIO
Maturity Type : Call
Maturity Date : 2025-12-31
Maturity Price : 25.00
Evaluated at bid price : 25.41
Bid-YTW : 2.72 %
FTS.PR.J Perpetual-Discount 1.44 % YTW SCENARIO
Maturity Type : Limit Maturity
Maturity Date : 2055-08-05
Maturity Price : 22.19
Evaluated at bid price : 22.47
Bid-YTW : 5.37 %
RY.PR.S FixedReset Prem 1.46 % YTW SCENARIO
Maturity Type : Call
Maturity Date : 2029-02-24
Maturity Price : 25.00
Evaluated at bid price : 26.45
Bid-YTW : 4.05 %
MFC.PR.M FixedReset Ins Non 1.65 % YTW SCENARIO
Maturity Type : Limit Maturity
Maturity Date : 2055-08-05
Maturity Price : 22.82
Evaluated at bid price : 23.99
Bid-YTW : 5.62 %
RY.PR.N Perpetual-Discount 1.71 % YTW SCENARIO
Maturity Type : Call
Maturity Date : 2025-09-04
Maturity Price : 25.00
Evaluated at bid price : 25.00
Bid-YTW : 1.80 %
PWF.PR.T FixedReset Disc 1.73 % YTW SCENARIO
Maturity Type : Limit Maturity
Maturity Date : 2055-08-05
Maturity Price : 22.98
Evaluated at bid price : 24.15
Bid-YTW : 5.54 %
CIU.PR.A Perpetual-Discount 1.86 % YTW SCENARIO
Maturity Type : Limit Maturity
Maturity Date : 2055-08-05
Maturity Price : 20.25
Evaluated at bid price : 20.25
Bid-YTW : 5.79 %
MFC.PR.L FixedReset Ins Non 1.89 % YTW SCENARIO
Maturity Type : Limit Maturity
Maturity Date : 2055-08-05
Maturity Price : 22.96
Evaluated at bid price : 24.20
Bid-YTW : 5.45 %
BN.PR.M Perpetual-Discount 2.11 % YTW SCENARIO
Maturity Type : Limit Maturity
Maturity Date : 2055-08-05
Maturity Price : 20.81
Evaluated at bid price : 20.81
Bid-YTW : 5.79 %
BN.PF.D Perpetual-Discount 2.50 % YTW SCENARIO
Maturity Type : Limit Maturity
Maturity Date : 2055-08-05
Maturity Price : 21.29
Evaluated at bid price : 21.29
Bid-YTW : 5.84 %
SLF.PR.G FixedReset Ins Non 3.17 % YTW SCENARIO
Maturity Type : Limit Maturity
Maturity Date : 2055-08-05
Maturity Price : 18.57
Evaluated at bid price : 18.57
Bid-YTW : 5.89 %
Volume Highlights
Issue Index Shares
Traded
Notes
BMO.PR.Y FixedReset Disc 75,900 YTW SCENARIO
Maturity Type : Call
Maturity Date : 2025-09-24
Maturity Price : 25.00
Evaluated at bid price : 24.96
Bid-YTW : 4.60 %
FFH.PR.K FixedReset Prem 37,500 YTW SCENARIO
Maturity Type : Call
Maturity Date : 2027-03-31
Maturity Price : 25.00
Evaluated at bid price : 25.20
Bid-YTW : 4.88 %
IFC.PR.C FixedReset Ins Non 28,000 YTW SCENARIO
Maturity Type : Limit Maturity
Maturity Date : 2055-08-05
Maturity Price : 23.50
Evaluated at bid price : 24.00
Bid-YTW : 5.70 %
BN.PF.K 22,400 YTW SCENARIO
Maturity Type : Limit Maturity
Maturity Date : 2055-08-05
Maturity Price : 22.00
Evaluated at bid price : 15.80
Bid-YTW : 7.47 %
BN.PF.H FixedReset Prem 18,900 YTW SCENARIO
Maturity Type : Call
Maturity Date : 2025-12-31
Maturity Price : 25.00
Evaluated at bid price : 25.18
Bid-YTW : 4.40 %
PWF.PR.A Floater 18,500 YTW SCENARIO
Maturity Type : Limit Maturity
Maturity Date : 2055-08-05
Maturity Price : 13.75
Evaluated at bid price : 13.75
Bid-YTW : 6.34 %
There were 9 other index-included issues trading in excess of 10,000 shares.
Wide Spread Highlights
See TMX DataLinx: ‘Last’ != ‘Close’ and the posts linked therein for an idea of why these quotes are so horrible.
Issue Index Quote Data and Yield Notes
BIP.PR.F FixedReset Disc Quote: 22.90 – 25.24
Spot Rate : 2.3400
Average : 1.3315

YTW SCENARIO
Maturity Type : Limit Maturity
Maturity Date : 2055-08-05
Maturity Price : 22.33
Evaluated at bid price : 22.90
Bid-YTW : 6.62 %

GWO.PR.H Insurance Straight Quote: 20.10 – 22.38
Spot Rate : 2.2800
Average : 1.3566

YTW SCENARIO
Maturity Type : Limit Maturity
Maturity Date : 2055-08-05
Maturity Price : 20.10
Evaluated at bid price : 20.10
Bid-YTW : 6.12 %

ENB.PR.H FixedReset Disc Quote: 21.00 – 22.76
Spot Rate : 1.7600
Average : 1.0682

YTW SCENARIO
Maturity Type : Limit Maturity
Maturity Date : 2055-08-05
Maturity Price : 21.00
Evaluated at bid price : 21.00
Bid-YTW : 6.43 %

GWO.PR.G Insurance Straight Quote: 22.30 – 23.90
Spot Rate : 1.6000
Average : 0.9589

YTW SCENARIO
Maturity Type : Limit Maturity
Maturity Date : 2055-08-05
Maturity Price : 22.07
Evaluated at bid price : 22.30
Bid-YTW : 5.90 %

MFC.PR.B Insurance Straight Quote: 20.65 – 22.50
Spot Rate : 1.8500
Average : 1.3012

YTW SCENARIO
Maturity Type : Limit Maturity
Maturity Date : 2055-08-05
Maturity Price : 20.65
Evaluated at bid price : 20.65
Bid-YTW : 5.72 %

POW.PR.B Perpetual-Discount Quote: 23.50 – 24.49
Spot Rate : 0.9900
Average : 0.5756

YTW SCENARIO
Maturity Type : Limit Maturity
Maturity Date : 2055-08-05
Maturity Price : 23.20
Evaluated at bid price : 23.50
Bid-YTW : 5.74 %

Issue Comments

ENB.PF.G To Reset To 5.626%

Enbridge Inc. has announced:

that it does not intend to exercise its right to redeem its currently outstanding Cumulative Redeemable Preference Shares, Series 15 (Series 15 Shares) (TSX: ENB.PF.G) on September 1, 2025. As a result, subject to certain conditions, the holders of the Series 15 Shares have the right to convert all or part of their Series 15 Shares on a one-for-one basis into Cumulative Redeemable Preference Shares, Series 16 of Enbridge (Series 16 Shares) on September 1, 2025. Holders who do not exercise their right to convert their Series 15 Shares into Series 16 Shares will retain their Series 15 Shares.

The foregoing conversion right is subject to the conditions that: (i) if Enbridge determines that there would be less than 1,000,000 Series 15 Shares outstanding after September 1, 2025, then all remaining Series 15 Shares will automatically be converted into Series 16 Shares on a one-for-one basis on September 1, 2025; and (ii) alternatively, if Enbridge determines that there would be less than 1,000,000 Series 16 Shares outstanding after September 1, 2025, no Series 15 Shares will be converted into Series 16 Shares. There are currently 11,000,000 Series 15 Shares outstanding.

With respect to any Series 15 Shares that remain outstanding after September 1, 2025, holders thereof will be entitled to receive quarterly fixed cumulative preferential cash dividends, as and when declared by the Board of Directors of Enbridge. The new annual dividend rate applicable to the Series 15 Shares for the five-year period commencing on September 1, 2025 to, but excluding, September 1, 2030 will be 5.626 percent, being equal to the five-year Government of Canada bond yield of 2.946 percent determined as of today plus 2.68 percent in accordance with the terms of the Series 15 Shares.

With respect to any Series 16 Shares that may be issued on September 1, 2025, holders thereof will be entitled to receive quarterly floating rate cumulative preferential cash dividends, as and when declared by the Board of Directors of Enbridge. The dividend rate applicable to the Series 16 Shares for the three-month floating rate period commencing on September 1, 2025 to, but excluding, December 1, 2025 will be 1.33882 percent, based on the annual rate on three month Government of Canada treasury bills for the most recent treasury bills auction of 2.69 percent plus 2.68 percent in accordance with the terms of the Series 16 Shares (the Floating Quarterly Dividend Rate). The Floating Quarterly Dividend Rate will be reset every quarter.

Beneficial holders of Series 15 Shares who wish to exercise their right of conversion during the conversion period, which runs from August 2, 2025 until 5:00 p.m. (EST) on August 18, 2025, should communicate as soon as possible with their broker or other intermediary for more information. It is recommended that this be done well in advance of the deadline in order to provide the broker or other intermediary time to complete the necessary steps. Any notices received after this deadline will not be valid.

ENB.PF.G is a FixedReset, 4.40%+268, that commenced trading 2014-9-23 after being announced 2014-9-11. It reset to 2.983% in 2020. It is tracked by HIMIPref™ and is assigned to the FixedReset (Discount) index.

Thanks to Assiduous Reader niagara for bringing this to my attention!

Update, 2025-09-02: Enbridge Inc. has announced (on 2025-08-18):

that none of its outstanding Cumulative Redeemable Preference Shares, Series 15 (Series 15 Shares) will be converted into Cumulative Redeemable Preference Shares, Series 16 (Series 16 Shares) on September 1, 2025.

After taking into account all conversion notices received from holders of its outstanding Series 15 Shares by the August 18, 2025 deadline for the conversion of the Series 15 Shares into Series 16 Shares, less than the 1,000,000 Series 15 Shares required to give effect to conversions into Series 16 Shares were tendered for conversion.

MAPF

MAPF Performance: July, 2025

Malachite Aggressive Preferred Fund’s Net Asset Value per Unit as of the close July 31, 2025, was $11.8941.

Quotes at July month-end were of fair quality, but now without the occasional howler. The quote for MFC.PR.B, for instance, had to be adjusted for fund valuation purposes, with the bid adjusted from 20.65 to 21.97.

Performance was affected by poor performance from IFC.PR.C (-0.54%) and CM.PR.S (+1.06%), more than offset by contributions from FTS.P.M (+4.99%); SLF.PR.D (+5.28%); and TRP.PR.E (+9.56%) [small holdings are not considered for individual mention here].

FixedResets continue to yield slightly more, in general, than PerpetualDiscounts although the spread narrowed somewhat in June; on June 30, I reported median YTWs of 6.25% and 5.74%, respectively, for these two indices; compare with mean Current Yields of 5.54% and 5.65%, respectively.

Returns to July 31, 2025
Period MAPF TXPR*
Total Return
CPD – according to RBCGAM
One Month +3.85% +3.19% +3.2%
Three Months +15.89% +11.40% +11.2%
One Year +24.51% +18.25% +17.5%
Two Years (annualized) +27.66% +19.96% N/A
Three Years (annualized) +16.22% +10.03% +9.4%
Four Years (annualized) +8.77% +5.54% N/A
Five Years (annualized) +16.67% +9.94% +9.3%
Six Years (annualized) +12.45% +7.75% N/A
Seven Years (annualized) +7.52% +5.14% N/A
Eight Years (annualized) +7.90% +5.15% N/A
Nine Years (annualized) +9.95% +6.40% N/A
Ten Years (annualized) +8.20% +5.48% +4.9%
Eleven Years (annualized) +6.34% +3.82%  
Twelve Years (annualized) +6.59% +3.90%  
Thirteen Years (annualized) +6.22% +3.63%  
Fourteen Years (annualized) +5.98% +3.67%  
Fifteen Years (annualized) +6.61% +4.11%  
Sixteen Years (annualized) +7.14% +4.35%  
Seventeen Years (annualized) +9.56% +4.44%  
Eighteen Years (annualized) +8.56% +3.68%  
Nineteen Years (annualized) +8.40%    
Twenty Years (annualized) +8.20%    
Twenty-One Years (annualized) +8.16%    
Twenty-Two Years (annualized) +8.64%    
Twenty-Three Years (annualized) +8.84%    
Twenty-Four Years (annualized) +8.95%    
MAPF returns assume reinvestment of distributions, and are shown after expenses but before fees.
The BMO Capital Markets “50” Preferred Share Index is no longer being calculated. The final performance report incorporating this venerable index was published as of December, 2020.
“TXPR” is the S&P/TSX Preferred Share Index. It is calculated without accounting for fees, but does assume reinvestment of dividends.
CPD Returns are for the NAV and are after all fees and expenses. Reinvestment of dividends is assumed.
All fund and ETF returns shown below are after all fees and expenses
Figures for NBI Preferred Equity Income Fund, Series F [NBC780] (formerly Omega Preferred Equity) (which are after all fees and expenses) for 1-, 3- and 12-months are +%, +% and +%, respectively, according to National Bank Investments after all fees & expenses. Three year performance is +%; five year is +%; ten year is +%.

Figures from Morningstar are no longer conveniently available.

Manulife Preferred Income Class Adv has been terminated by Manulife. The performance of this fund was last reported here in March, 2018.
Figures for Horizons GlobalX Active Preferred Share ETF (HPR) (which are after all fees and expenses) for 1-, 3- and 12-months are +3.73%, +12.67% & +19.04%, respectively. Three year performance is +11.80%, five-year is +12.18%, ten year is +6.36%
Figures for NBI Preferred Equity Fund Series F [NBC710] (formerly Altamira Preferred Equity Fund) are +%, +% and +% for one-, three- and twelve months, respectively. Three year performance is +%; five-year is +%; ten-year is +%

Acccording to the fund’s fact sheet as of June 30, 2016, the fund’s inception date was October 30, 2015. I do not know how they justify this nonsensical statement, but will assume that prior performance is being suppressed in some perfectly legal manner that somebody at National considers ethical.

The last time Altamira Preferred Equity Fund’s performance was reported here was April, 2014; performance under the National Bank banner was first reported here May, 2014.

The figures for the NAV of BMO Laddered Preferred Share Index ETF (ZPR) is +20.51% for the past twelve months. Two year performance is +21.90%, three year is +11.29%, five year is +11.99%, ten year is +5.92%

Note that analysis of ZPR shows some doubt as to whether this fund is either "laddered" or an "index fund". However, there was a remarkable improvement in the laddering in the six months following the publication of my analysis.

Figures for Fiera Canadian Preferred Share Class Cg Series F, (formerly Natixis Canadian Preferred Share Class Series F) (formerly NexGen Canadian Preferred Share Tax Managed Fund) are no longer available as the Fund is now the property of Canoe Financial. The last reported performance for the merged fund was May 2020.
Figures for BMO Preferred Share Fund (advisor series) are not available as the fund has been terminated. This is as per an announcement by the bank on 2024-5-28. The last performance report for this awful fund was as of July 31, 2024.
Figures for PowerShares Canadian Preferred Share Index Class, Series F (PPS) are no longer available since the fund has been terminated. Performance was last reported for the fund to month-end, March 2023
Figures for the First Asset Preferred Share Investment Trust (PSF.UN) are no longer available since the fund has merged with First Asset Preferred Share ETF (FPR).

Performance for the fund was last reported here in September, 2016; the first report of unavailability was in October, 2016.

Figures for Lysander-Slater Preferred Share Dividend Fund (Class F) according to the company are +2.0%, +6.7% and +12.5% for the past one, three and twelve months, respectively. Three year performance is +9.0%, five-year is +11.4%, ten-year is +4.8%.
Figures for the Desjardins Canadian Preferred Share Fund F Class (F Class), as reported by the company are +3.12%, +11.19% and +16.62% for the past one, three and twelve months, respectively. Two year performance is +18.73%, three-year is +9.39%, five-year is +9.10%
Figures for the RBC Canadian Preferred Share ETF (RPF) are reported as +3.5%, +13.5% and +20.8% for the past one, three and twelve months, respectively. Three-year performance is +10.6%, five-year is +11.4%
Figures for the Dynamic Active Preferred Shares ETF (DXP) are +3.5%, +12.2% and +19.4% for the past one, three and twelve months, respectively. Three-year performance is +12.5%; five-year is +13.5%
Figures for the Purpose Canadian Preferred Share Fund (Class F) are +3.18%, +11.26% and +17.52% for the past one, three and twelve months, respectively. Three-year performance is +10.28%; four-year is +5.70%; five-year is +13.31%; seven-year is +5.22%; ten-year is +6.39%.
Figures for the TD Active Preferred Share ETF (TPRF) are +%, +% and +% for the past one, three and twelve months, respectively. Two-year performance is +%, three-year is +%; five-year is +%.

Note that “The TD ETF may also hold common shares, government and corporate bonds, and other income-producing securities. … The TD ETF may invest in foreign securities to an extent that will vary from time to time but is not typically expected to exceed 5% of its assets at the time that foreign securities are purchased.

The non-preferred share components of the portfolio are relatively minor – as of their year-end 2023 report, they had $1.6-million in Canadian Natural Resources Limited common, $1.8-million in RBC common, $1.6-million in SLF common, and $1.75-million in Fortis common, totalling $6.75-million in a $220-million portfolio.

I take the view that the purpose of this mandate is to destroy, or at least deprecate, comparability. Banks hate comparability.

I must say, reporting by the banks was exceptionally poor this month. No data are yet available at the usual locations for the two National Bank preferred share funds in the table above; nor has the TD fund had a performance update. RBC just barely saved their bacon with respect to the two funds they report – they did not have July data as of late last night (August 8) when I checked, but it is available on the morning of August 9. The “Other People’s Money” department at banks is generally sub-standard, but this month is egregious. One would think that if anybody in Canada had the scale to automate absolutely everything and have little cron-job programmes running regularly to ensure that all necessary data was collected promptly and carefully inserted into its proper place (or an exception report generated after a proper interval and sent to the appropriate escalation level of management), it would be the banks … but this appears to be the purview of giant operations like Hymas Investment Management Inc.

The five-year Canada yield decreased, with the five-year Canada yield (“GOC-5”) moving from 2.85% on June 30 to 3.09% at July month-end.

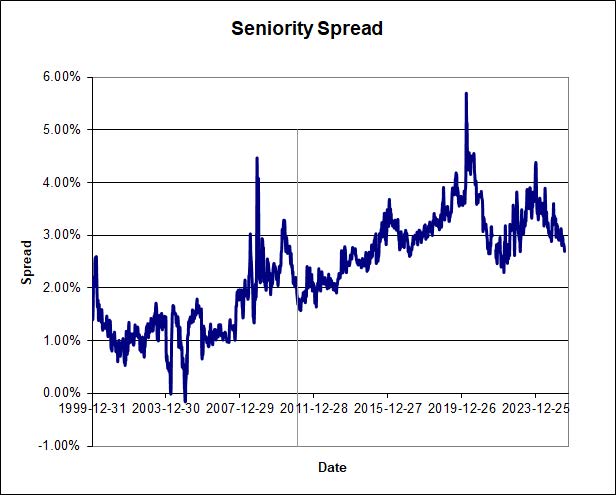
The Seniority Spread (between long-term corporate bonds and interest-equivalent PerpetualDiscounts) was 255bp on 2025-7-30, down significantly from the 280bp on 2025-6-25 (chart end-date 2025-07-11).

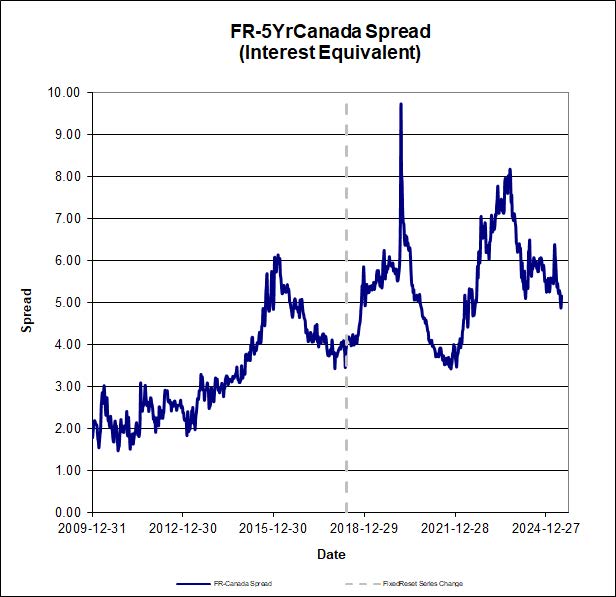
The situation with FixedResets is interesting, with the spread between GOC-5 and the interest-adjusted FixedReset (Discount) rate widening significantly (despite recent narrowing) from its 2021-11-10 low of 344bp to a level of 506bp (as of 2025-7-30) … (chart end-date 2025-7-11):

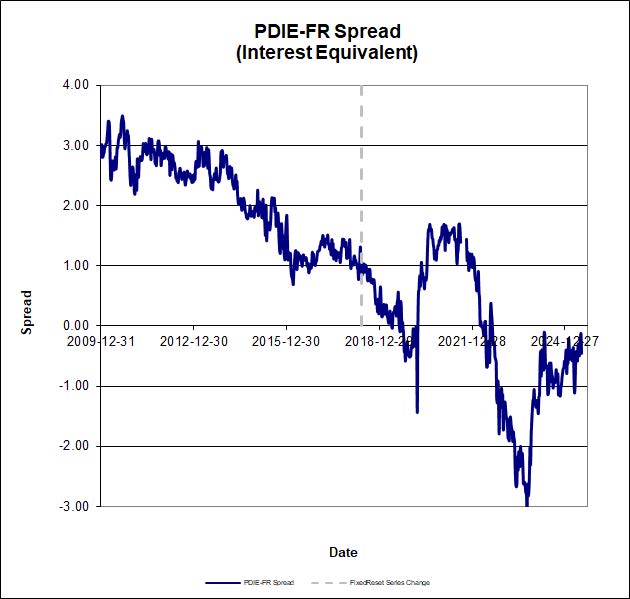
…while at the same time the interest-equivalent spread between FixedReset (Discounts) and PerpetualDiscounts has narrowed to -58bp (as of 2025-07-30) from its 2021-7-28 level of +170bp (chart end-date 2025-7-11):

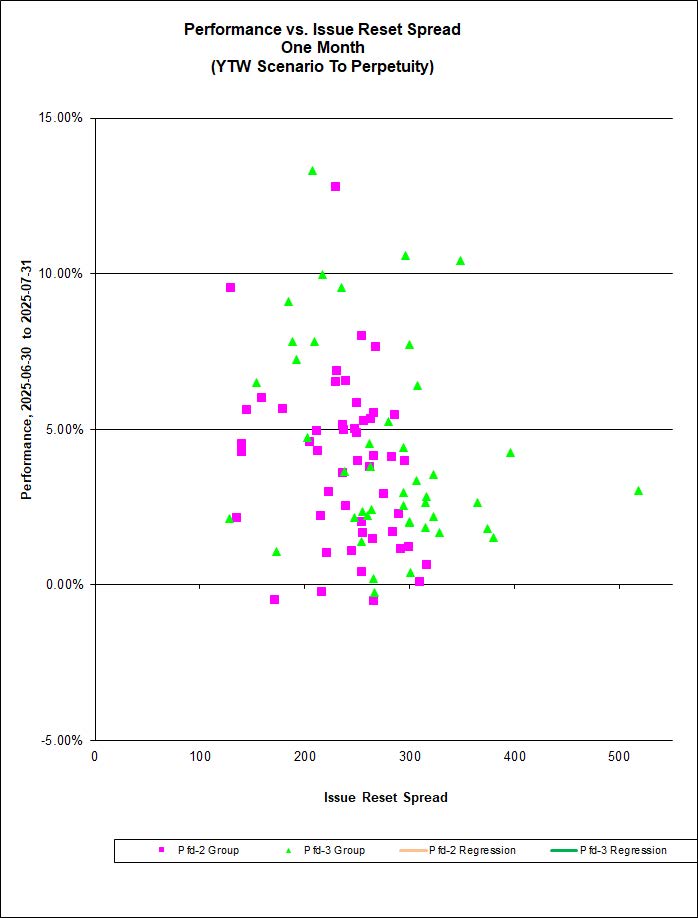
There is no correlation between the Issue Reset Spread and 1-month performance for discounted FixedResets for either the Pfd-2 Group or for Pfd-3 Group issues.

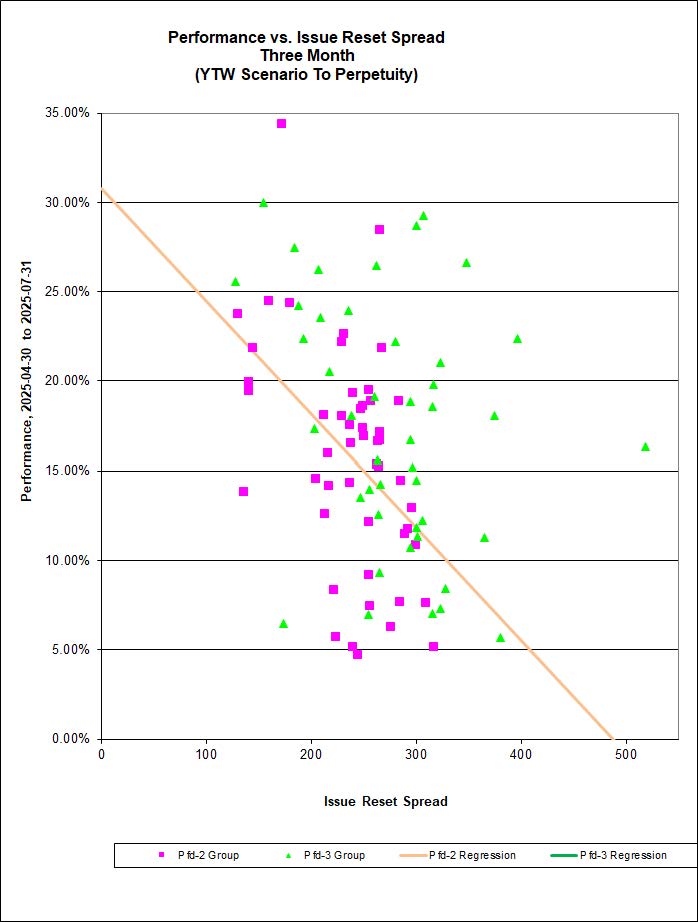
There is no correlation for the Pfd-2 group but there is one for the Pfd-3 group (20%) between the Issue Reset Spread and 3-month performance for discounted FixedResets.

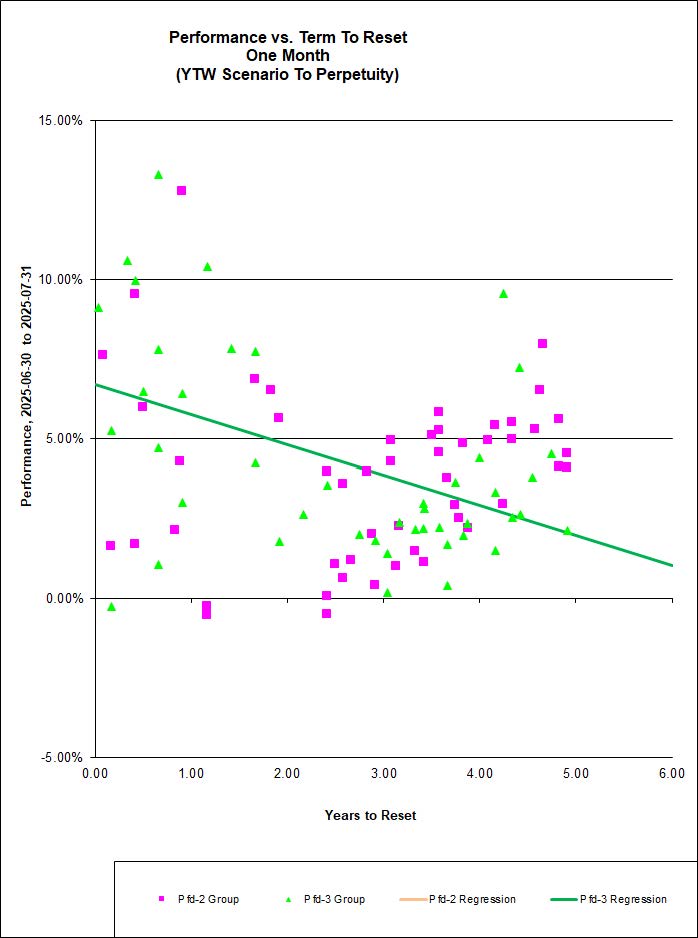
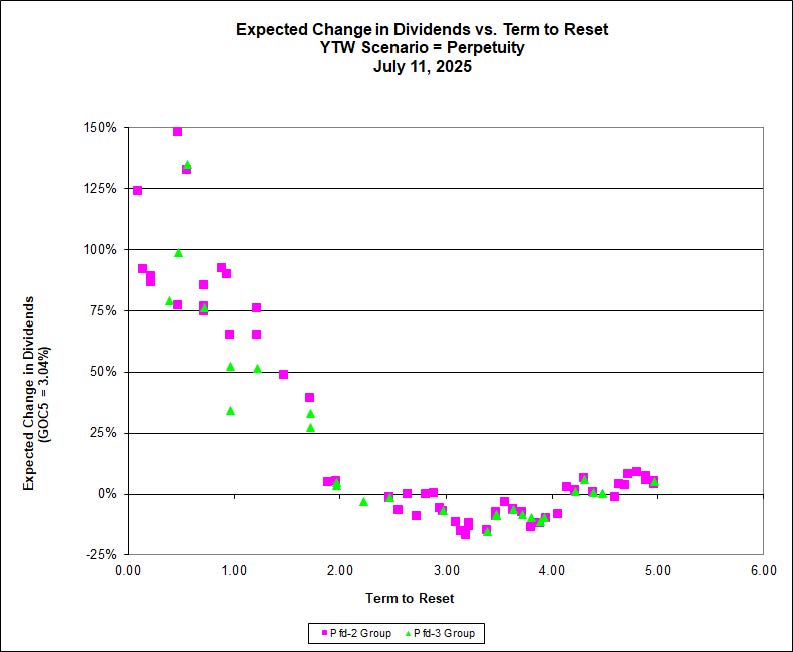
There is no correlation for the Pfd-2 Group but one for the Pfd-3 Group (19%) for 1-Month performance against term-to-reset:

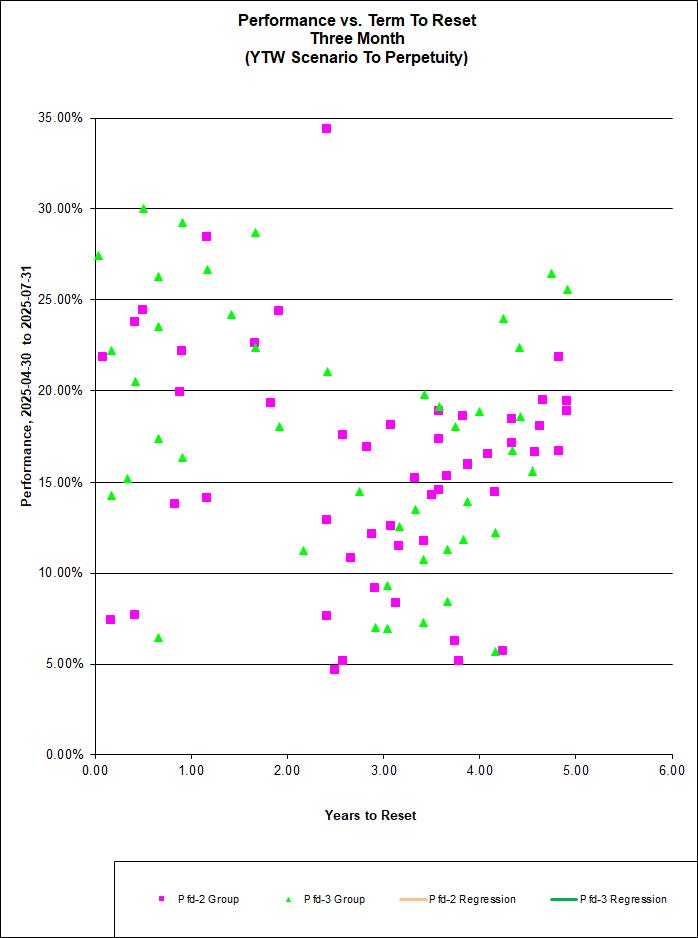
… while the three-month returns vs. Term to Reset, shows no correlations for either the Pfd-2 Group or the Pfd-3 Group:

It should be noted that to some extent a dependence (of performance on term-to-reset) can be justified as the nearer-term issues will receive the benefit (adverse effects) of higher (lower) projected dividend rates sooner as a result of higher GOC-5 yields and therefore, perhaps, for longer. Equations for the relationship between correlation slope and change in GOC-5 were derived in the August 2022 PrefLetter.

Upward-sloping correlations of Performance vs. Term are to be expected when GOC-5 declines.

I keep talking about ‘Sustainable Income’ and it still exceeds – by a much smaller margin than previously – dividends that are currently being distributed. This is because Sustainable Income is the average yield-to-worst (YTW) of the portfolio when the YTW is calculated to perpetuity (or to redemption, of course, if the yield to redemption is lower), including resets at the current GOC-5 rate. The sharp increase in GOC-5 in the past few years has caused the difference between YTW and Current Yield to skyrocket, but one way or another I expect that these two values will become much closer – slowly at first, but quickening in the fairly near future. We have to wait for the reset date of the MAPF portfolio securities before we see a change in actual cash receipts – and, of course, there is no guarantee whatsoever that the rate used for estimation purposes now will be used for the actual calculation in the future (chart prepared as of 2025-7-11).

I will note that the fund’s current holdings of FixedResets are now paying dividends based on their previous reset at an average GOC-5 rate of 2.54% (weighted by shares held)

Calculation of MAPF Sustainable Income Per Unit
Month NAVPU Portfolio
Average
YTW
Leverage
Divisor
Securities
Average
YTW
Capital
Gains
Multiplier
Sustainable
Income
per
current
Unit
June, 2007 9.3114 5.16% 1.03 5.01% 1.3240 0.3524
September 9.1489 5.35% 0.98 5.46% 1.3240 0.3773
December, 2007 9.0070 5.53% 0.942 5.87% 1.3240 0.3993
March, 2008 8.8512 6.17% 1.047 5.89% 1.3240 0.3938
June 8.3419 6.034% 0.952 6.338% 1.3240 $0.3993
September 8.1886 7.108% 0.969 7.335% 1.3240 $0.4537
December, 2008 8.0464 9.24% 1.008 9.166% 1.3240 $0.5571
March 2009 $8.8317 8.60% 0.995 8.802% 1.3240 $0.5872
June 10.9846 7.05% 0.999 7.057% 1.3240 $0.5855
September 12.3462 6.03% 0.998 6.042% 1.3240 $0.5634
December 2009 10.5662 5.74% 0.981 5.851% 1.1141 $0.5549
March 2010 10.2497 6.03% 0.992 6.079% 1.1141 $0.5593
June 10.5770 5.96% 0.996 5.984% 1.1141 $0.5681
September 11.3901 5.43% 0.980 5.540% 1.1141 $0.5664
December 2010 10.7659 5.37% 0.993 5.408% 1.0298 $0.5654
March, 2011 11.0560 6.00% 0.994 5.964% 1.0298 $0.6403
June 11.1194 5.87% 1.018 5.976% 1.0298 $0.6453
September 10.2709 6.10%
Note
1.001 6.106% 1.0298 $0.6090
December, 2011 10.0793 5.63%
Note
1.031 5.805% 1.0000 $0.5851
March, 2012 10.3944 5.13%
Note
0.996 5.109% 1.0000 $0.5310
June 10.2151 5.32%
Note
1.012 5.384% 1.0000 $0.5500
September 10.6703 4.61%
Note
0.997 4.624% 1.0000 $0.4934
December, 2012 10.8307 4.24% 0.989 4.287% 1.0000 $0.4643
March, 2013 10.9033 3.87% 0.996 3.886% 1.0000 $0.4237
June 10.3261 4.81% 0.998 4.80% 1.0000 $0.4957
September 10.0296 5.62% 0.996 5.643% 1.0000 $0.5660
December, 2013 9.8717 6.02% 1.008 5.972% 1.0000 $0.5895
March, 2014 10.2233 5.55% 0.998 5.561% 1.0000 $0.5685
June 10.5877 5.09% 0.998 5.100% 1.0000 $0.5395
September 10.4601 5.28% 0.997 5.296% 1.0000 $0.5540
December, 2014 10.5701 4.83% 1.009 4.787% 1.0000 $0.5060
March, 2015 9.9573 4.99% 1.001 4.985% 1.0000 $0.4964
June, 2015 9.4181 5.55% 1.002 5.539% 1.0000 $0.5217
September 7.8140 6.98% 0.999 6.987% 1.0000 $0.5460
December, 2015 8.1379 6.85% 0.997 6.871% 1.0000 $0.5592
March, 2016 7.4416 7.79% 0.998 7.805% 1.0000 $0.5808
June 7.6704 7.67% 1.011 7.587% 1.0000 $0.5819
September 8.0590 7.35% 0.993 7.402% 1.0000 $0.5965
December, 2016 8.5844 7.24% 0.990 7.313% 1.0000 $0.6278
March, 2017 9.3984 6.26% 0.994 6.298% 1.0000 $0.5919
June 9.5313 6.41% 0.998 6.423% 1.0000 $0.6122
September 9.7129 6.56% 0.998 6.573% 1.0000 $0.6384
December, 2017 10.0566 6.06% 1.004 6.036% 1.0000 $0.6070
March, 2018 10.2701 6.22% 1.007 6.177% 1.0000 $0.6344
June 10.2518 6.22% 0.995 6.251% 1.0000 $0.6408
September 10.2965 6.62% 1.018 6.503% 1.0000 $0.6696
December, 2018 8.6875 7.16% 0.997 7.182% 1.0000 $0.6240
March, 2019 8.4778 7.09% 1.007 7.041% 1.0000 $0.5969
June 8.0896 7.33% 0.996 7.359% 1.0000 $0.5953
September 7.7948 7.96% 0.998 7.976% 1.0000 $0.6217
December, 2019 8.0900 6.03% 0.995 6.060% 1.0000 $0.4903
March 5.5596 7.04% 1.006 6.998% 1.0000 $0.3891
June 6.3568 6.10% 0.9900 6.162% 1.0000 $0.3917
September 7.2852 5.32% 1.00 5.320% 1.0000 $0.3876
December, 2020 8.3947 4.46% 0.999 4.464% 1.0000 $0.3747
March, 2021 9.6473 4.48% 0.996 4.498% 1.0000 $0.4339
June 10.3712 3.92% 0.985 3.980% 1.0000 $0.4127
September 10.7572 4.08% 1.017 4.012% 1.0000 $0.4316
December, 2021 10.7432 4.31% 0.999 4.314% 1.0000 $0.4635
March, 2022 10.5040 5.53% 1.004 5.508% 1.0000 $0.5786
June 9.3115 7.04% 0.993 7.090% 1.0000 $0.6672
September 8.4093 8.10% 0.997 8.124% 1.0000 $0.6916
December, 2022 7.9921 8.47% 0.996 8.504% 1.0000 $0.6796
March, 2023 8.0788 7.90% 0.997 7.924% 1.0000 $0.6401
June 30 8.0197 9.19% 1.003 9.163% 1.0000 $0.7348
September 29 7.9922 9.86% 0.997 9.890% 1.0000 $0.7904
Decenber 29, 2023 8.4715 8.14% 1.002 8.124% 1.0000 $0.6882
March 28,2024 9.5892 7.60% 1.006 7.555% 1.0000 $0.7244
June 28 9.8516 7.32% 0.999 7.327% 1.0000 $0.7219
September 30 10.3641 6.55% 0.990 6.616% 1.0000 $0.6857
December 31,2024 11.0142 6.44% 0.992 6.492% 1.0000 $0.7150
March 31,2025 10.8891 6.22% 0.993 6.264% 1.0000 $0.6821
June 30 11.4529 6.10% 0.997 6.118% 1.0000 $0.7007
July,2025 11.8941 6.09% 1.005 6.060% 1.0000 $0.7207
NAVPU is shown after quarterly distributions of dividend income and annual distribution of capital gains.
Portfolio YTW includes cash (or margin borrowing), with an assumed interest rate of 0.00%
The Leverage Divisor indicates the level of cash in the account: if the portfolio is 1% in cash, the Leverage Divisor will be 0.99
Securities YTW divides “Portfolio YTW” by the “Leverage Divisor” to show the average YTW on the securities held; this assumes that the cash is invested in (or raised from) all securities held, in proportion to their holdings.
The Capital Gains Multiplier adjusts for the effects of Capital Gains Dividends. On 2009-12-31, there was a capital gains distribution of $1.989262 which is assumed for this purpose to have been reinvested at the final price of $10.5662. Thus, a holder of one unit pre-distribution would have held 1.1883 units post-distribution; the CG Multiplier reflects this to make the time-series comparable. Note that Dividend Distributions are not assumed to be reinvested.
Sustainable Income is the resultant estimate of the fund’s dividend income per current unit, before fees and expenses. Note that a “current unit” includes reinvestment of prior capital gains; a unitholder would have had the calculated sustainable income with only, say, 0.9 units in the past which, with reinvestment of capital gains, would become 1.0 current units.
DeemedRetractibles are comprised of all Straight Perpetuals (both PerpetualDiscount and PerpetualPremium) issued by BMO, BNS, CM, ELF, GWO, HSB, IAG, MFC, NA, RY, SLF and TD, which are not exchangable into common at the option of the company or the regulator (definition refined in May, 2011). These issues are analyzed as if their prospectuses included a requirement to redeem at par on or prior to 2022-1-31 (banks) or the Deemed Maturity date for insurers and insurance holding companies (see below)), in addition to the call schedule explicitly defined. See the Deemed Retractible Review: September 2016 for the rationale behind this analysis.

The same reasoning is also applied to FixedResets from these issuers, other than explicitly defined NVCC from banks.

In November, 2019, the assumption of DeemedRetraction for insurance issues was cancelled in the wake of the IAIS decision included in ICS 2.0. This resulted in a large drop in the yield calculated for these issues

The Deemed Maturity date for insurers was set at 2022-1-31 at the commencement of the process in February, 2011. It was extended to 2025-1-31 in April, 2013 and to 2030-1-31 in December, 2018. In November, 2019, the assumption of DeemedRetraction was cancelled in the wake of the IAIS decision included in ICS 2.0.
Yields for September, 2011, to January, 2012, were calculated by imposing a cap of 10% on the yields of YLO issues held, in order to avoid their extremely high calculated yields distorting the calculation and to reflect the uncertainty in the marketplace that these yields will be realized. From February to September 2012, yields on these issues have been set to zero. All YLO issues held were sold in October 2012.

These calculations were performed assuming constant contemporary GOC-5 and 3-Month Bill rates, as follows:

Canada Yields Assumed in Calculations
Month-end GOC-5 3-Month Bill
September, 2015 0.78% 0.40%
December, 2015 0.71% 0.46%
March, 2016 0.70% 0.44%
June 0.57% 0.47%
September 0.58% 0.53%
December, 2016 1.16% 0.47%
March, 2017 1.08% 0.55%
June 1.35% 0.69%
September 1.79% 0.97%
December, 2017 1.83% 1.00%
March, 2018 2.06% 1.08%
June 1.95% 1.22%
September 2.33% 1.55%
December, 2018 1.88% 1.65%
March, 2019 1.46% 1.66%
June 1.34% 1.66%
September 1.41% 1.66%
December, 2019 1.68% 1.68%
March, 2020 0.57% 0.21%
June 0.37% 0.21%
September 0.35% 0.14%
December, 2020 0.42% 0.08%
March, 2021 0.94% 0.09%
June 0.93% 0.13%
September 1.07% 0.13%
December, 2021 1.31% 0.16%
March, 2022 2.44% 0.53%
June 3.24% 2.11%
September 3.45% 3.60%
December, 2022 3.37% 4.35%
March, 2023 2.93% 4.44%
June 3.74% 5.00%
September 4.31% 5.21%
December, 2023 3.21% 5.13%
March, 2024 3.55% 5.06%
June 3.41% 4.71%
September 2.74% 3.94%
December, 2024 3.02% 3.19%
March, 2025 2.64% 2.66%
June 2.85% 2.68%
July, 2025 3.09% 2.68%
MAPF

MAPF Portfolio Composition: July, 2025

Turnover remained very low at 3% in July.

Sectoral distribution of the MAPF portfolio on July 31, 2025, was:

MAPF Sectoral Analysis 2025-07-31
HIMI Indices Sector Weighting YTW ModDur
Ratchet 0% N/A N/A
FixFloat 0% N/A N/A
Floater 11.4% 6.90% 12.65
OpRet 0% N/A N/A
SplitShare 0% N/A N/A
Interest Rearing 0% N/A N/A
PerpetualPremium 0% N/A N/A
PerpetualDiscount 5.2% 5.70% 14.39
Fixed-Reset Discount 31.1% 6.12% 13.67
Insurance – Straight 22.3% 5.52% 14.62
FloatingReset 0% N/A N/A
FixedReset Premium 8.4% 5.48% 14.66
FixedReset Bank non-NVCC 0% N/A N/A
FixedReset Insurance non-NVCC 9.3% 5.88% 14.30
Scraps – Ratchet 1.2% 7.23% 13.22
Scraps – FixedFloater 0% N/A N/A
Scraps – Floater 0% N/A N/A
Scraps – OpRet 0% N/A N/A
Scraps – SplitShare 0% N/A N/A
Scraps – PerpPrem 0% N/A N/A
Scraps – PerpDisc 0% N/A N/A
Scraps – FR Discount 10.6% 6.76% 13.17
Scraps – Insurance Straight 0% N/A N/A
Scraps – FloatingReset 0% N/A N/A
Scraps – FR Premium 0% N/A N/A
Scraps – Bank non-NVCC 0% N/A N/A
Scraps – Ins non-NVCC 0% N/A N/A
Cash -0.5% 0.00% 0.00
Total 100% 6.09% 13.86
Totals and changes will not add precisely due to rounding. Cash is included in totals with duration and yield both equal to zero.
The various “Scraps” indices include issues with a DBRS rating of Pfd-3(high) or lower and issues with an Average Trading Value (calculated with HIMIPref™ methodology, which is relatively complex) of less than $25,000. The issues considered “Scraps” are subdivided into indices which reflect those of the main indices.
DeemedRetractibles were comprised of all Straight Perpetuals (both PerpetualDiscount and PerpetualPremium) issued by BMO, BNS, CM, ELF, GWO, HSB, IAG, MFC, NA, RY, SLF and TD, which are not exchangable into common at the option of the company or the regulator. These issues are analyzed as if their prospectuses included a requirement to redeem at par on or prior to 2022-1-31 in the case of banks or normally in the case of insurers and insurance holding companies, in addition to the call schedule explicitly defined. See the Deemed Retractible Review: September 2016 for the rationale behind this analysis and IAIS Says No To DeemedRetractions for the recent change in policy with respect to insurers.

Note that the estimate for the time this will become effective for insurers and insurance holding companies was extended by three years in April 2013, due to the delays in OSFI’s providing clarity on the issue and by a further five years in December, 2018; the estimate was eliminated in November. However, the distinctions are being kept because it is useful to distinguish insurance issues from others.

The name of this subindex has been changed to “Insurance Straight” as of November, 2020

Calculations of yield and related attributes of resettable instruments are performed assuming a constant GOC-5 rate of 3.09%, a constant 3-Month Bill rate of 2.68% and a constant Canada Prime Rate of 4.95%

The “total” reflects the un-leveraged total portfolio (i.e., cash is included in the portfolio calculations and is deemed to have a duration and yield of 0.00.). MAPF will often have relatively large cash balances, both credit and debit, to facilitate trading. Figures presented in the table have been rounded to the indicated precision.

Credit distribution is:

MAPF Credit Analysis 2025-07-31
DBRS Rating MAPF Weighting
Pfd-1 0
Pfd-1(low) 0
Pfd-2(high) 36.8%
Pfd-2 30.2%
Pfd-2(low) 20.8%
Pfd-3(high) 8.2%
Pfd-3 2.2%
Pfd-3(low) 2.3%
Pfd-4(high) 0%
Pfd-4 0%
Pfd-4(low) 0%
Pfd-5(high) 0%
Pfd-5 0%
Cash -0.5%
Totals will not add precisely due to rounding.

Liquidity Distribution is:

MAPF Liquidity Analysis 2025-07-31
Average Daily Trading MAPF Weighting
<$50,000 2.9%
$50,000 – $100,000 58.6%
$100,000 – $200,000 20.0%
$200,000 – $300,000 18.1%
>$300,000 1.0%
Cash -0.5%
Totals will not add precisely due to rounding.

The distribution of Issue Reset Spreads is:

Range MAPF Weight
<100bp 0%
100-149bp 1.0%
150-199bp 1.6%
200-249bp 42.8%
250-299bp 11.8%
300-349bp 0.4%
350-399bp 1.9%
400-449bp 0%
450-499bp 0%
500-549bp 0%
550-599bp 0%
>= 600bp 0%
Undefined 40.6%

Distribution of Floating Rate Start Dates is shown in the table below. This is the date of the next adjustment to the dividend rate, if the issue is currently paying a fixed rate for a limited time; which in practice is successive terms of 5 years. Issues that adjust quarterly are considered “Currently Floating”.

Range MAPF Weight
Currently Floating 12.6%
0-1 Year 1.0%
1-2 Years 25.1%
2-3 Years 8.4%
3-4 Years 0%
4-5 Years 24.8%
5-6 Years 0%
>6 Years 0%
Not Floating Rate 28.0%

MAPF is, of course, Malachite Aggressive Preferred Fund, a “unit trust” managed by Hymas Investment Management Inc. Further information and links to performance, audited financials and subscription information are available the fund’s web page. The fund may be purchased directly from Hymas Investment Management. A “unit trust” is like a regular mutual fund, but are not sold with a prospectus This is cheaper, but means subscription is restricted to “accredited investors” (as defined by the Ontario Securities Commission). Fund past performances are not a guarantee of future performance. You can lose money investing in MAPF or any other fund.

Market Action

August 1, 2025

TXPR closed at 677.46, down 0.52% on the day. Volume today was 1.17-million, well below the median of the past 21 trading days.

CPD closed at 13.43, down 0.44% on the day. Volume was 35,450, below the median of the past 21 trading days.

ZPR closed at 11.81, down 0.59% on the day. Volume was 102,240, second-highest of the past 21 trading days.

Five-year Canada yields were down 8bp to 2.94%.

Equities got whacked:

Stocks suffered heavy losses Friday and shorter-term U.S. Treasury yields plunged the most in two years after an unexpectedly weak jobs report shattered investors’ confidence in the strength of the American economy as historic tariffs were imposed against several trading partners.

Money markets are now putting odds of a quarter-point cut by the Federal Reserve at around 85 per cent, from just under 40 per cent a day earlier, according to data from CME FedWatch. Rate futures are now pricing in more than 50 basis points of easing over the course of this year.

The Dow Jones Industrial Average fell 542.40 points, or 1.23 per cent, to 43,588.58, the S&P 500 lost 101.38 points, or 1.60 per cent, to 6,238.01 and the Nasdaq Composite lost 472.32 points, or 2.24 per cent, to 20,650.13.

For the week, the S&P 500 fell 2.36 per cent, the Nasdaq declined 2.17 per cent, and the Dow fell 2.92 per cent.

The S&P/TSX Composite Index ended down 239.35 points, or 0.9 per cent, at 27,020.43, extending its pullback from a record closing high on Tuesday. For the week, the TSX was down 1.7 per cent.

Canadian data was also downbeat Friday. Canada’s manufacturing sector contracted for a sixth straight month in July as tariffs undercut trade with the U.S. and spurred firms to reduce inventory as well as staffing levels.

All ten major sectors on the TSX ended lower, led by a 2.4-per-cent decline for technology.

With all that, today’s fall in TXPR basically offsets its 45bp rise yesterday, July 31 – and much of the movement may be ascribed to reinvestment of the CM.PR.Q and TD.PF.D redemption money on July 31 and subsequent snap-back.

This is a day late – sorry about that!

The US jobs number disappointed yesterday:

Employers continued to create jobs but pulled back on hiring, a sign that more businesses are putting expansion plans on hold as they deal with economic uncertainty created by President Trump.

The economy added 73,000 jobs last month, the Labor Department reported on Friday, lower than economists’ expectations. The unemployment rate slightly rose to 4.2 percent, up from 4.1 percent the month before.

In a sign that the labor market may not have been as robust as it seemed earlier this year, job gains from the previous two months were also revised down by a total of 258,000, an unusually high number.

Wages continued to grow in July. Average hourly earnings climbed 0.3 percent from the prior month and 3.9 percent over the year.

The disappointment infuriated the WhackADoodle:

President Donald Trump has fired Dr. Erika McEntarfer, the commissioner of the Bureau of Labor Statistics, whom he accused, without evidence, of manipulating the monthly jobs reports for “political purposes.”

“In my opinion, today’s Jobs Numbers were RIGGED in order to make the Republicans, and ME, look bad,” Trump said in a Truth Social post.

Trump said McEntarfer “faked” the jobs numbers before the election to try to boost former Vice President Kamala Harris’ chances in the 2024 presidential election.

Firing the bearer of bad news is the most clear-cut evidence of bad management I can imagine. But I am leaning towards the idea that the objective is to undermine confidence in the American government:

All of this badgering coincides with what already appears to be a long-term decline in the trust for the Fed. For now, inflation expectations remain reasonable, and Mr. Trump has backed away from firing Mr. Powell outright. But the far-flung consequences of undermining people’s belief in the central bank is that they may decide they no longer value its independence. It is this weakening of that value that may be Trump’s true legacy on the U.S. monetary system, which, if it persists, will have far more severe consequences than the soundbites alone.

To the extent that this succeeds, the influence of American oligarchs will be enhanced. Too conspiratorial? Perhaps. But what other explanation is there?

HIMIPref™ Preferred Indices
These values reflect the December 2008 revision of the HIMIPref™ Indices

Values are provisional and are finalized monthly
Index Mean
Current
Yield
(at bid)
Median
YTW
Median
Average
Trading
Value
Median
Mod Dur
(YTW)
Issues Day’s Perf. Index Value
Ratchet 0.00 % 0.00 % 0 0.00 0 -0.0783 % 2,353.3
FixedFloater 0.00 % 0.00 % 0 0.00 0 -0.0783 % 4,581.0
Floater 6.79 % 6.88 % 67,073 12.67 2 -0.0783 % 2,640.0
OpRet 0.00 % 0.00 % 0 0.00 0 0.0281 % 3,679.8
SplitShare 4.76 % 4.35 % 52,995 2.41 7 0.0281 % 4,394.5
Interest-Bearing 0.00 % 0.00 % 0 0.00 0 0.0281 % 3,428.7
Perpetual-Premium 0.00 % 0.00 % 0 0.00 0 -0.1195 % 3,044.0
Perpetual-Discount 5.65 % 5.74 % 46,312 14.25 32 -0.1195 % 3,319.3
FixedReset Disc 5.63 % 6.33 % 120,281 13.19 39 -0.2529 % 3,023.9
Insurance Straight 5.56 % 5.67 % 60,136 14.38 19 -0.1174 % 3,254.2
FloatingReset 5.50 % 5.37 % 37,607 14.82 2 -0.3058 % 3,712.9
FixedReset Prem 5.89 % 4.93 % 113,076 2.57 15 -0.2125 % 2,628.8
FixedReset Bank Non 0.00 % 0.00 % 0 0.00 0 -0.2529 % 3,091.0
FixedReset Ins Non 5.23 % 5.74 % 68,270 14.01 14 -0.8772 % 3,060.0
Performance Highlights
Issue Index Change Notes
BN.PR.R FixedReset Disc -5.07 % YTW SCENARIO
Maturity Type : Limit Maturity
Maturity Date : 2055-08-01
Maturity Price : 19.10
Evaluated at bid price : 19.10
Bid-YTW : 6.95 %
SLF.PR.G FixedReset Ins Non -3.95 % YTW SCENARIO
Maturity Type : Limit Maturity
Maturity Date : 2055-08-01
Maturity Price : 18.00
Evaluated at bid price : 18.00
Bid-YTW : 6.22 %
MFC.PR.M FixedReset Ins Non -3.83 % YTW SCENARIO
Maturity Type : Limit Maturity
Maturity Date : 2055-08-01
Maturity Price : 22.63
Evaluated at bid price : 23.60
Bid-YTW : 5.84 %
IFC.PR.I Insurance Straight -3.64 % YTW SCENARIO
Maturity Type : Limit Maturity
Maturity Date : 2055-08-01
Maturity Price : 22.59
Evaluated at bid price : 23.00
Bid-YTW : 5.93 %
MFC.PR.C Insurance Straight -2.86 % YTW SCENARIO
Maturity Type : Limit Maturity
Maturity Date : 2055-08-01
Maturity Price : 21.03
Evaluated at bid price : 21.03
Bid-YTW : 5.43 %
PWF.PR.T FixedReset Disc -2.51 % YTW SCENARIO
Maturity Type : Limit Maturity
Maturity Date : 2055-08-01
Maturity Price : 22.79
Evaluated at bid price : 23.74
Bid-YTW : 5.77 %
BN.PF.D Perpetual-Discount -2.03 % YTW SCENARIO
Maturity Type : Limit Maturity
Maturity Date : 2055-08-01
Maturity Price : 20.77
Evaluated at bid price : 20.77
Bid-YTW : 5.98 %
MFC.PR.L FixedReset Ins Non -1.86 % YTW SCENARIO
Maturity Type : Limit Maturity
Maturity Date : 2055-08-01
Maturity Price : 22.75
Evaluated at bid price : 23.75
Bid-YTW : 5.69 %
POW.PR.D Perpetual-Discount -1.70 % YTW SCENARIO
Maturity Type : Limit Maturity
Maturity Date : 2055-08-01
Maturity Price : 21.75
Evaluated at bid price : 22.00
Bid-YTW : 5.73 %
SLF.PR.C Insurance Straight -1.67 % YTW SCENARIO
Maturity Type : Limit Maturity
Maturity Date : 2055-08-01
Maturity Price : 21.24
Evaluated at bid price : 21.24
Bid-YTW : 5.30 %
POW.PR.A Perpetual-Discount -1.63 % YTW SCENARIO
Maturity Type : Limit Maturity
Maturity Date : 2055-08-01
Maturity Price : 23.85
Evaluated at bid price : 24.10
Bid-YTW : 5.86 %
BN.PF.E FixedReset Disc -1.42 % YTW SCENARIO
Maturity Type : Limit Maturity
Maturity Date : 2055-08-01
Maturity Price : 21.50
Evaluated at bid price : 21.50
Bid-YTW : 6.49 %
CU.PR.D Perpetual-Discount -1.34 % YTW SCENARIO
Maturity Type : Limit Maturity
Maturity Date : 2055-08-01
Maturity Price : 21.81
Evaluated at bid price : 22.05
Bid-YTW : 5.64 %
FTS.PR.J Perpetual-Discount -1.12 % YTW SCENARIO
Maturity Type : Limit Maturity
Maturity Date : 2055-08-01
Maturity Price : 21.91
Evaluated at bid price : 22.15
Bid-YTW : 5.44 %
BIP.PR.F FixedReset Disc -1.04 % YTW SCENARIO
Maturity Type : Limit Maturity
Maturity Date : 2055-08-01
Maturity Price : 23.21
Evaluated at bid price : 24.70
Bid-YTW : 6.20 %
ENB.PR.J FixedReset Disc -1.02 % YTW SCENARIO
Maturity Type : Limit Maturity
Maturity Date : 2055-08-01
Maturity Price : 21.97
Evaluated at bid price : 22.37
Bid-YTW : 6.53 %
PWF.PR.S Perpetual-Discount 1.24 % YTW SCENARIO
Maturity Type : Limit Maturity
Maturity Date : 2055-08-01
Maturity Price : 21.20
Evaluated at bid price : 21.20
Bid-YTW : 5.70 %
FTS.PR.G FixedReset Disc 1.38 % YTW SCENARIO
Maturity Type : Limit Maturity
Maturity Date : 2055-08-01
Maturity Price : 23.07
Evaluated at bid price : 24.23
Bid-YTW : 5.61 %
GWO.PR.R Insurance Straight 1.42 % YTW SCENARIO
Maturity Type : Limit Maturity
Maturity Date : 2055-08-01
Maturity Price : 21.41
Evaluated at bid price : 21.41
Bid-YTW : 5.68 %
CU.PR.J Perpetual-Discount 1.59 % YTW SCENARIO
Maturity Type : Limit Maturity
Maturity Date : 2055-08-01
Maturity Price : 21.38
Evaluated at bid price : 21.67
Bid-YTW : 5.56 %
PWF.PR.E Perpetual-Discount 1.65 % YTW SCENARIO
Maturity Type : Limit Maturity
Maturity Date : 2055-08-01
Maturity Price : 23.84
Evaluated at bid price : 24.09
Bid-YTW : 5.74 %
SLF.PR.E Insurance Straight 3.23 % YTW SCENARIO
Maturity Type : Limit Maturity
Maturity Date : 2055-08-01
Maturity Price : 21.42
Evaluated at bid price : 21.42
Bid-YTW : 5.32 %
MFC.PR.B Insurance Straight 4.21 % YTW SCENARIO
Maturity Type : Limit Maturity
Maturity Date : 2055-08-01
Maturity Price : 21.25
Evaluated at bid price : 21.52
Bid-YTW : 5.46 %
Volume Highlights
Issue Index Shares
Traded
Notes
BN.PR.Z FixedReset Disc 81,041 YTW SCENARIO
Maturity Type : Limit Maturity
Maturity Date : 2055-08-01
Maturity Price : 22.98
Evaluated at bid price : 23.81
Bid-YTW : 6.41 %
BEP.PR.G FixedReset Ins Non 51,700 YTW SCENARIO
Maturity Type : Call
Maturity Date : 2026-01-31
Maturity Price : 25.00
Evaluated at bid price : 25.09
Bid-YTW : 4.79 %
CU.PR.C FixedReset Disc 40,900 YTW SCENARIO
Maturity Type : Limit Maturity
Maturity Date : 2055-08-01
Maturity Price : 23.57
Evaluated at bid price : 23.92
Bid-YTW : 5.79 %
BN.PF.A FixedReset Disc 36,600 YTW SCENARIO
Maturity Type : Limit Maturity
Maturity Date : 2055-08-01
Maturity Price : 23.30
Evaluated at bid price : 24.85
Bid-YTW : 6.20 %
RY.PR.M FixedReset Disc 27,350 YTW SCENARIO
Maturity Type : Call
Maturity Date : 2025-11-24
Maturity Price : 25.00
Evaluated at bid price : 24.82
Bid-YTW : 4.72 %
ENB.PR.T FixedReset Disc 27,095 YTW SCENARIO
Maturity Type : Limit Maturity
Maturity Date : 2055-08-01
Maturity Price : 22.16
Evaluated at bid price : 22.68
Bid-YTW : 6.48 %
There were 9 other index-included issues trading in excess of 10,000 shares.
Wide Spread Highlights
See TMX DataLinx: ‘Last’ != ‘Close’ and the posts linked therein for an idea of why these quotes are so horrible.
Issue Index Quote Data and Yield Notes
PVS.PR.L SplitShare Quote: 26.08 – 28.25
Spot Rate : 2.1700
Average : 1.2893

YTW SCENARIO
Maturity Type : Hard Maturity
Maturity Date : 2030-06-30
Maturity Price : 25.00
Evaluated at bid price : 26.08
Bid-YTW : 4.73 %

CU.PR.D Perpetual-Discount Quote: 22.05 – 23.30
Spot Rate : 1.2500
Average : 0.7746

YTW SCENARIO
Maturity Type : Limit Maturity
Maturity Date : 2055-08-01
Maturity Price : 21.81
Evaluated at bid price : 22.05
Bid-YTW : 5.64 %

BN.PR.R FixedReset Disc Quote: 19.10 – 21.00
Spot Rate : 1.9000
Average : 1.4589

YTW SCENARIO
Maturity Type : Limit Maturity
Maturity Date : 2055-08-01
Maturity Price : 19.10
Evaluated at bid price : 19.10
Bid-YTW : 6.95 %

SLF.PR.G FixedReset Ins Non Quote: 18.00 – 19.00
Spot Rate : 1.0000
Average : 0.5645

YTW SCENARIO
Maturity Type : Limit Maturity
Maturity Date : 2055-08-01
Maturity Price : 18.00
Evaluated at bid price : 18.00
Bid-YTW : 6.22 %

IFC.PR.I Insurance Straight Quote: 23.00 – 24.25
Spot Rate : 1.2500
Average : 0.8160

YTW SCENARIO
Maturity Type : Limit Maturity
Maturity Date : 2055-08-01
Maturity Price : 22.59
Evaluated at bid price : 23.00
Bid-YTW : 5.93 %

PVS.PR.M SplitShare Quote: 25.69 – 26.69
Spot Rate : 1.0000
Average : 0.6564

YTW SCENARIO
Maturity Type : Hard Maturity
Maturity Date : 2031-03-31
Maturity Price : 25.00
Evaluated at bid price : 25.69
Bid-YTW : 4.78 %