Category: Interesting External Papers

Interesting External Papers

S&P Releases 2009 Transition Study

Standard & Poor’s has released its 2009 Annual Global Corporate Default Study And Rating Transitions:

Last year set many new records in terms of global corporate default and transition performance. There were 264 defaults globally, the highest annual total since our database began in 1981 (see Table 1). The rated debt amount affected by these defaults reached $627.7 billion, also a series high. Distressed exchanges featured prominently as a trigger, accounting for 39% of defaults globally and 55% of total debt affected by defaults.

Credit degradation among nondefaulting issuers was widespread and pronounced, especially in the first half of 2009, with the percentage of issuers downgraded during the course of the year reaching 18.34%, the highest rate in 29 years (see Table 6). There were 3.85 downgrades for every upgrade, the worst ratio on record. In addition, the average number of notches recorded among downgrades rose in 2009 to 1.76, a pace unmatched since 2002 (see Chart 12).

Financials featured disproportionately among issuers that experienced downgrades of seven or more notches. Meanwhile, global speculative-grade default rates—expressed as a percentage of the issuer count—rose to levels that, though not unprecedented, had not been seen since 1991, driven by trends in the U.S. (see Chart 1).

Interesting External Papers

BoE Releases 2010 Q1 Quarterly Bulletin

The Bank of England has released the 2010 Q1 Quarterly Bulletin, with articles on:

  • Markets and operations
  • Interpreting equity price movements since the start of the financial crisis
  • The Bank’s balance sheet during the crisis
  • Changes in output, employment and wages during recessions in the United Kingdom
  • Summaries of recent Bank of England working papers
  • …and other topics

The first section had some notes on bank financing:

At longer horizons, banks face a challenge to secure funding to replace government-sponsored schemes which will expire over the next couple of years. As part of their strategy to address this funding gap, banks issued a significant amount of senior debt over recent months (Chart 21). This included record issuance from UK banks in January, although issuance was markedly weaker in February. And while many government-guarantee schemes continued, some banking sectors reduced their dependence on these.

Contacts also reported that banks were increasingly looking to securitisation and covered bond markets to raise funds. Covered bond issuance continued to increase; including from banks whose issuance was not eligible for ECB purchase. Prospects for issuance of mortgage-backed securities also reportedly improved. Total issuance in the first months of 2010 remained limited (Chart 22), despite individual issues by, for example, Lloyds Banking Group and Co-operative Bank. Other banks were reported to be preparing for future issuance, however, including the possibility of issues that do not give the investor an option to sell back the debt.

However, despite recent debt issuance, contacts highlighted that for many banks the combined pace of long-term funding was not yet sufficient to meet refinancing needs without some corresponding reduction in assets. And while capital markets remained open for banks to issue subordinated debt, contacts noted that banks may have little incentive to issue such securities in light of the uncertainty about prospective changes to prudential regulation. Specifically, the Basel Committee on Banking Supervision released a consultative document that raised questions about whether new issuance would be counted as capital going forward.


Click for Big

Retail bond investors will find the new LSE programme of interest:

In response to demand from retail investors, on 1 February 2010 the London Stock Exchange launched a new electronic order system for bonds. Similar to arrangements for individuals to deal in shares, the new service offers continuous two-way pricing for trading in increments of as little as £1 for gilts and £1,000 for corporate bonds. Normally these investments would trade in units of £50,000.

Initially, 49 gilts and ten corporate bonds are available for trading including securities issued by a range of large companies and a bond issued specifically for this new service by Royal Bank of Scotland. The new market is supported by dedicated market makers.

I can’t say I found the paper on dividends all that interesting, but some readers might:

Equity markets have experienced large price movements since the financial crisis began in mid-2007. Understanding the factors that drive equity prices is important for policymakers as they may contain information about the future course of the economy. This article uses a simple model to decompose recent equity price movements into changes in earnings expectations, the risk-free rate and the equity risk premium. Indicative evidence suggests that changes in earnings expectations can account for some, but by no means all, of the shifts in equity prices since mid-2007. Policy actions by central banks and governments are likely to have supported equity prices, for example by lowering government bond yields and reducing the likelihood of more severe downside risks to the economy materialising. The latter may also have contributed to a fall in the implied level of the equity risk premium, which had increased sharply during the financial crisis.

One reason I like the BoE publications is the time series:


Click for Big

So just be glad we didn’t have another 1720 (South Sea Bubble) all over again! You want to whimper about asset bubbles? You don’t know NUTHIN’ about bubbles!

Interesting External Papers

Themis Trading on Pegged Orders

Themis Trading will be known to Assiduous Readers due to its presence on the right-hand links panel. Sal L. Arnuk and Joseph Saluzzi write in Toxic Equity Trading Order Flow on Wall Street:

More than half of all institutional algo orders are “pegged” to the National Best Bid or Offer (NBBO). The problem is, if one trader jumps ahead of another in price, it can cause a second trader to go along side of the first one. Very quickly, every algo trading order in a given stock is following each other up or down (or down and up), creating huge, whip like price movements on relatively little volume.

This has led to the development of predatory algo trading strategies. These strategies are designed to cause institutional algo orders to buy or sell shares at prices higher or lower than where the stock had been trading, creating a situation where the predatory algo can lock in a profit from the artificial increase or decrease in the price.

To illustrate, let’s use an institutional algo order pegged to the NBBO with discretion to pay up to $20.10. First, the predatory algo uses methods similar to the liquidity rebate trader to spot this as an institutional algo order. Next, with a bid of $20.01, the predatory algo goes on the attack. The institutional algo immediately goes to $20.01. Then, the predatory algo goes $20.02, and the institutional algo follows. In similar fashion, the predatory algo runs up the institutional algo to its $20.10 limit. At that point, the predatory algo sells the stock short at $20.10 to the institutional algo, knowing it is highly likely that the price of the stock will fall. When it does, the predatory algo covers.
This is how a stock can move 10 or 15 cents on a handful of 100 or 500 share trades.

This is the type of behaviour considered desirable by Omega ATS in their response to the pegged order consultation.

So the question is: is such behaviour a Good Thing or a Bad Thing?

I suggest that this is a good thing. Intra-day volatility leads to a wider variety of entry- and exit-points for real-money players who have bothered to calculate entry- and exit-points. If I own Stock A and want to swap it into Stock B, I must definitely have a spread in mind: if I don’t, then I am grossly incompetent.

Themis’ example represents a bleeding of money from incompetent real-money players into those of the day traders and to competent real-money players; thus, it can be thought of as a Public Good, since it will serve to help differentiate between skill levels on the buy side.

Interesting External Papers

The Fed Funds Market During the Financial Crisis

The Federal Reserve Bank of New York has released a Staff Report by Gara Afonso, Anna Kovner, and Antoinette Schoar titled Stressed, Not Frozen: The Federal Funds Market in the Financial Crisis:

This paper examines the impact of the financial crisis of 2008, specifically the bankruptcy of Lehman Brothers, on the federal funds market. Rather than a complete collapse of lending in the presence of a market-wide shock, we see that banks became more restrictive in their choice of counterparties. Following the Lehman bankruptcy, we find that amounts and spreads became more sensitive to a borrowing bank’s characteristics. While the market did not contract dramatically, lending rates increased. Further, the market did not seem to expand to meet the increased demand predicted by the drop in other bank funding markets. We examine discount window borrowing as a proxy for unmet fed funds demand and find that the fed funds market is not indiscriminate. As expected, borrowers who access the discount window have a lower return on assets. On the lender side, we do not find that the characteristics of the lending bank significantly affect the amount of interbank loans it makes. In particular, we do not find that worse performing banks began hoarding liquidity and indiscriminately reducing their lending.

Normally, Fed Funds borrowers are allocated a line by their lender and rates are generic within that limit. After the Lehman bankruptcy, rate stratification was observed:

We use transaction level data of participants in the fed funds market to investigate the provision of credit in this market after the Lehman Brothers’ bankruptcy. We find a much more nuanced picture: Under “normal” or pre-crisis conditions the fed funds market functions via rationing of riskier borrowers rather than prices, e.g. adjustments of spreads.1 After Lehman we see a different picture emerge: In the days immediately after the Lehman Brothers’ bankruptcy the market seems to become sensitive to bank specific characteristics, not only in the amounts lent to borrowers but even in the cost of overnight funds. We see sharp differences between large and small banks in their access to credit: Large banks (especially those with high percentages of nonperforming loans) show drastically reduced daily borrowing amounts after Lehman and borrow from fewer counterparties. In fact, the interest rate spread at which large banks borrow in the fed funds market after Lehman falls below pre-crisis levels after September 16th, 2008. We interpret this initial response as an effect of credit rationing. In contrast, smaller banks were able to increase the amount borrowed from the interbank markets and even managed to add lending counterparties during the crisis; but to do so they faced higher interest rate spreads. Different from the predictions of many theoretical models of interbank lending, when faced with a market wide shock, we do not observe a complete cessation of lending but instead we see increased differentiation between borrowers of high versus low type.

Too-Big-to-Fail moral hazard had an immediate market effect:

After the AIG bailout is announced, spreads for the largest banks fall steeply, falling below the rate in the week before Lehman. We interpret the return to pre-crisis spreads as the effect of the government’s support for systematically important banks, because the same is not true for small banks: these banks continue to face higher spreads till well after the announcement of the CPP.

There was a high degree of differentiation shown by discount window usage:

Because of the high interest rate and potential for stigma, banks usually access the discount window only if they face severe unmet liquidity needs. Thus use of the discount window gives a lower bound for the unmet liquidity needs in the fed funds market. We find that even in the days after the Lehman Brothers’ bankruptcy only very poorly performing banks, those with low ROA, access the discount window. It seems reasonable to assume that these are banks which were rationed by private banks lending in the fed funds market. While again it is difficult to assess whether this means that interbank markets operated efficiently after the crisis, it is, however, reassuring that we do not observe that well performing banks are forced to turn to the discount window. This would have been a very alarming indication of dysfunction in the fed funds market.

Interesting External Papers

Why Weren't Irish Banks Resilient?

Paul Krugman writes an op-ed piece in the New York Times today, titled An Irish Mirror:

So what can we learn from the way Ireland had a U.S.-type financial crisis with very different institutions? Mainly, that we have to focus as much on the regulators as on the regulations. By all means, let’s limit both leverage and the use of securitization — which were part of what Canada did right. But such measures won’t matter unless they’re enforced by people who see it as their duty to say no to powerful bankers.

That’s why we need an independent agency protecting financial consumers — again, something Canada did right — rather than leaving the job to agencies that have other priorities. And beyond that, we need a sea change in attitudes, a recognition that letting bankers do what they want is a recipe for disaster. If that doesn’t happen, we will have failed to learn from recent history — and we’ll be doomed to repeat it.

I find his insistence on the need for securitization to be limited somewhat puzzling: the authors of his source material go out of their way to stress that securitization was not a major factor in the Irish debacle.

The source paper is a paper by Gregory Connor, Thomas Flavin and Brian O’Kelly titled The U.S. and Irish Credit Crises: Their Distinctive Differences and Common Features:

Although the US credit crisis precipitated it, the Irish credit crisis is an identifiably separate one, which might have occurred in the absence of the U.S. crash. The distinctive differences between them are notable. Almost all the apparent causal factors of the U.S. crisis are missing in the Irish case; and the same applies vice-versa. At a deeper level, we identify four common features of the two credit crises: capital bonanzas, irrational exuberance, regulatory imprudence, and moral hazard. The particular manifestations of these four “deep” common features are quite different in the two cases.

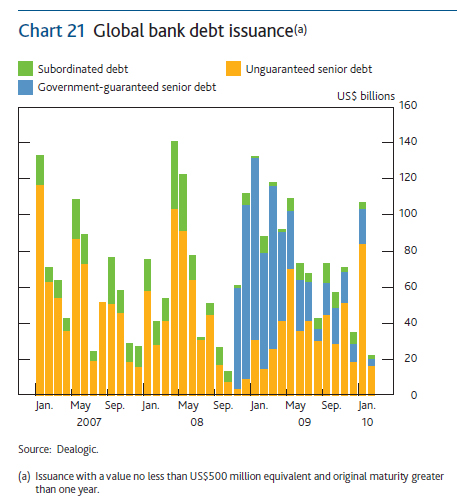
There is some support for the IMF’s thesis that stability of the funding base is important for overall stability:

In the case of Ireland, the capital bonanza was mediated by the Irish commercial banks. In 1999, Irish banks were funded primarily from domestic sources; see Table 1. By 2008, Irish customer deposits provided just 22% of domestic bank funding. Over 37% of the funding was obtained in the form of deposits and securities from the international capital markets. Directly in response to this capital inflow, the balance sheets of the Irish banks increased more than six-fold in the period 1999 to 2008. Lending to the non-financial private sector had grown to more than 200% of GDP by end of the period, approximately twice the European average (see Figure 5).

It is becoming more and more compelling to believe that the Basel Accords’ insistence that inter-bank loans should be risk-weighted according to the credit rating of their sovereign is a major contributor to financial instability.

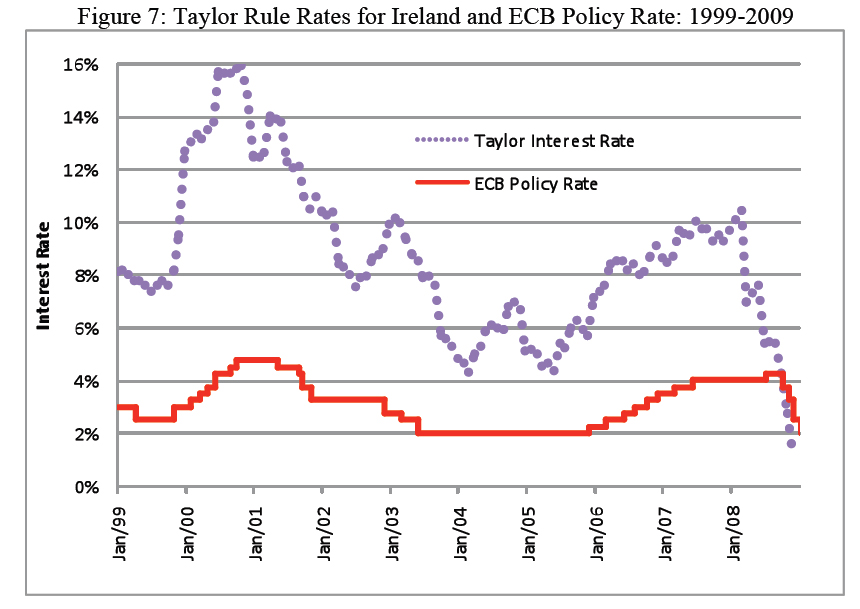
The authors also stress the relative looseness of monetary policy, as measured by the Taylor rule. This is food for Canadian thought, given the perpetual squawking over the Bank of Canada rate, which is by necessity applied nationally, over regions that can be performing very differently from each other.

After Ireland’s entry to the Euro zone, Irish banks funded much of their lending with short-term foreign borrowing. This allowed Irish financial institutions to extend much larger volumes of credit to borrowers at lower cost, as evidenced by Figure 6. As a small member of the Eurozone, Ireland does not have control of its interest rates, but Figure 7 shows an Irish target rate calculated from a standard Taylor rule. We set the target rate equal to 1/2 (GDP growth rate – 3%) + 1/2 (inflation rate – 2%) + 1%. Had Eurozone interest rates been set in accordance with a Taylor rule for Ireland, the interest rate would have been almost 6% higher on average during the period, and up to 12% higher in 2000.


Click for Big

As always, concentration is at the root of the problem:

Woods (2007) reports that, as a proportion of lending to the private sector, property related lending grew from 38% in 2001 to over 62% in 2007. With the enormous growth in property- and construction-related lending, the loan books of the Irish domestic banks were becoming increasingly undiversified.

Dr. Krugman glosses over a major similarity between the pre-crash climates in the US and Ireland. He believes that Fannie & Freddie’s role are overemphasized in the current debate; but they simply represent one way for the government to over-stimulate the housing sector. In Ireland the mechanism was different, but the results the same:

In addition to the enormous credit inflow, the over-heating of the property markets was exacerbated by government legislation that encouraged people to invest in property through a series of tax-incentive schemes. For example, generous tax relief was available to investors in hotels as the government sought to increase the stock of hotel rooms and hence tourism; similar breaks were available to individuals who built houses in seaside towns and in rural areas.

On the retail end, we can see some support for the Canadian regulatory response, when the maximum insurable amortization period was decreased along with the maximum LTV ratio:

A considerable decline in lending standards occurred in the Irish mortgage market; an increasing proportion of lending was done at higher loan-to-value, higher income multiples, longer maturities, and with interest-only periods. The only step the regulator took to stem the sharp decline in lending standards was to increase to 100% the risk-weighting on the portion of a residential mortgage written above an 80% loan-to-value threshold. As Honohan (2009) notes, this was a weak and ineffective response.

The familiar weaknesses of the American securitization process are dutifully trotted out, but the authors point out:

Despite its centrality to the US crisis, this particular moral hazard problem has no relevance to the Irish credit crisis. Throughout the bubble period Irish banks used the originate-and-hold lending system, for both residential mortgage and business lending. Almost all the loans that the Irish banks generated remained on their own balance sheets. This crucial component of the US crisis is virtually absent in the Irish case.

I have often criticized the lack of recourse in US mortgages; there is some skepticism as to the effectiveness of recourse in Ireland:

The property loans issued by Irish banks were obtained by wealthy property developers, arguably well-informed, rational actors with considerable business acumen. It is not clear whether a moral hazard argument can explain their behaviour. Personal guarantees were a standard component of property development loan contracts in Ireland during the bubble period, so most of these developers did not have recourse to the trader put option. Irish property developers are legally liable for the “tail risk” in the net value of these loans, including de jure claims against their personal assets.

This brings us to another potential source of moral hazard: weak law enforcement. This was likely an important source of moral hazard in the Irish case. The legal framework for personal bankruptcy in Ireland is antiquated and rarely activated. Although property developers signed de jure claims against their personal assets as part of their bank loan contracts, many commentators believe that these claims are de facto unenforceable in Ireland. There is also the concern in Ireland that politically powerful agents have the ability to manipulate regulatory and legislative processes to their advantages. Most large property developers in Ireland have been very closely connected to the ruling political party, Fianna Fáil. Kelly (2009) uses the term “too connected to fail” for this feature of the Irish business environment.

Interesting External Papers

BIS Releases 1Q10 Quarterly Review

The Bank for International Settlements has released the BIS Quarterly Review, March 2010, with articles:

  • Overview: sovereign risk jolts markets
  • Highlights of international banking and financial market activity
  • The architecture of global banking: from international to multinational?
  • Exchange rates during financial crises
  • The dependence of the financial system on central bank and government support
  • The term “macroprudential”: origins and evolution

They put the tempest in the teapot regarding sovereign CDS in context:


Click for big

Activity in the CDS market for developed country sovereign debt increased significantly as investors adjusted their exposure to sovereign risk. This market was virtually non-existent only a few years back, when sovereign CDS were mostly on emerging market economies, but has since grown rapidly. This increase in activity resulted in significantly higher outstanding volumes of CDS contracts (Graph 5, left-hand panel). Nevertheless, the amount of sovereign risk which is actually reallocated via CDS markets is much more limited than the gross outstanding volumes would suggest. The sovereign reallocated risk is captured by the net outstanding amount of CDS contracts, which takes into account that many CDS contracts offset each other and therefore do not result in any actual transfer of credit risk. Net CDS positions on Portugal amounted to only 5% of outstanding Portuguese government debt. For other countries, including Greece, the ratio of sovereign CDS contracts to government debt was even lower (Graph 5, right-hand panel).

Another item of interest is the long-dated paper in the GBP market:

Borrowers adjusted their debt profile to lock in cheap funding costs. They repaid money market instruments (with maturities of less than one year) and floating rate bonds and notes by $141 billion and $71 billion, respectively. Meanwhile, they issued fixed rate bonds and notes to the tune of $492 billion. The average maturity of fixed rate bonds and notes rose from a low of 6.3 years in the first quarter of 2009 to 9.8 years in the third. It then declined slightly to 9.3 years in the final quarter. This, however, was entirely due to the extraordinarily high average maturity of sterling-denominated bonds issued in the third quarter (Graph 7, left-hand panel), when the UK government and a various special purpose vehicles securitising mortgages issued a number of very large bonds with maturities of up to 57 years. In the fourth quarter, sterling-denominated bonds still had longer maturities on average than those in other currencies, perhaps reflecting the high appetite for such paper by UK pension funds, forced to match their assets and liabilities on a mark to market. basis.[footnote] Governments in particular lengthened the maturities of their debt, to almost 20 years (Graph 7, right-hand panel).

Footnote: This issue is explored in some detail in the box on page 7 of the March 2006 BIS Quarterly Review.


Click for big
Interesting External Papers

NY Fed Research on Financial Amplification and Liquidity Supply

The Federal Reserve Bank of New York has released a Staff Report by Asani Sarkar and Jeffrey Shrader titled Financial Amplification Mechanisms and the Federal Reserve’s Supply of Liquidity during the Crisis:

The small decline in the value of mortgage-related assets relative to the large total losses associated with the financial crisis suggests the presence of financial amplification mechanisms, which allow relatively small shocks to propagate through the financial system. We review the literature on financial amplification mechanisms and discuss the Federal Reserve’s interventions during different stages of the crisis in light of this literature. We interpret the Fed’s early-stage liquidity programs as working to dampen balance sheet amplifications arising from the positive feedback between financial constraints and asset prices. By comparison, the Fed’s later-stage crisis programs take into account adverse-selection amplifications that operate via increases in credit risk and the externality imposed by risky borrowers on safe ones. Finally, we provide new empirical evidence that increases in the Federal Reserve’s liquidity supply reduce interest rates during periods of high liquidity risk. Our analysis has implications for the impact on market prices of a potential withdrawal of liquidity supply by the Fed.

Of interest is the first sentence in the introduction:

One of the primary questions related to the recent financial crisis is how losses on subprime mortgage assets of roughly $500 billion led to rapid and deep drops in both the value of a wide range of other financial assets and, increasingly, real economic output.

Footnote: Acharya and Richardson (2009), Adrian and Shin (2009), Brunnermeier (2009), Gorton (2008) and Blanchard (2009), among others, describe the genesis of the crisis and provide explanations for how it was propagated

It is unfortunate that the authors do not provide more specific support for the $500-billion figure – this has been a topic of interest since the first figure of Greenlaw of $400-billion and much lower ultimate losses projected by the BoE and others.

There’s some discussion of interest to players in illiquid markets:

Brunnermeier and Pedersen (2009) examine the relationship between margin conditions and market illiquidity. In their model, customers with offsetting demand shocks arrive sequentially to the market. Speculators smooth the temporal order imbalance and thereby provide liquidity. They borrow using collateral from financiers who set margins (defined as the difference between the security’s price and its collateral value) to control their value-at-risk (VaR). Financiers can reset margins every period and so speculators face funding liquidity risk from the risk of higher margins or losses on existing positions. A margin spiral occurs as follows. Suppose markets are initially highly illiquid and margins are increasing in market illiquidity. There is no default risk in balance sheet models as loans are fully collaterized. A funding shock to the speculator lowers market liquidity and results in higher margins which causes speculators to delever, further tightening their funding constraints. Therefore, market liquidity falls even further.

The authors review the Fed’s programmes for liquidity provision and declare:

To understand the intent behind these programs, we examine amplification mechanisms based on asymmetric information between borrowers and lenders. In contrast to the balance sheet amplifiers, the focus here is on the role of credit risk and the distribution of credit risk across borrowers. The papers surveyed below find a role for central bank intervention when adverse selection problems lead to market breakdowns. However, they also raise concerns that public liquidity provision might crowd out private liquidity.

The authors conclude, in part:

We find that an increase in supply of funds by the Fed is associated with a reduction in interest rate spreads early in the crisis. During more recent periods, the Fed has been gradually withdrawing funds from some of its programs. We find that these actions have had no significant impact on interest rate spreads in the most recent period. Our results suggest that changes in the Fed’s liquidity supply might be asymmetrically related to change in the LIBOR-OIS spread: increases in supply tend to be associated with decreases in the spread but decreases in supply have a more variable relationship. These results indicate that the potential withdrawal of liquidity by the Fed is unlikely to have an adverse impact on market prices.

Interesting External Papers

Cleveland Fed Releases February Economic Trends

The Federal Reserve Bank of Cleveland has released the February 2010 edition of Economic Trends with articles:

  • December Price Statistics
  • Financial Markets, Money and Monetary Policy
  • What Is the Yield Curve Telling Us?…And Should We Have Listened?
  • A Sign of Normalization
  • Imports and Economic Growth
  • The Employment Situation, January 2010
  • Real GDP: Fourth-Quarter 2009 Advance Estimate
  • Fourth District Employment Conditions
  • Seriously Delinquent Mortgages in the Fourth District

There’s a fascinating note on used car prices:

Roughly half of the overall increase in the core CPI in December was due to a 35 percent increase in used car and truck prices. Th e unusual strength in used car and truck prices over the past five months (up nearly 31 percent) has been somewhat of a mystery. Initially, the story read as if the CARS program negatively impacted used auto supply, driving up auction prices. However, it’s hard to imagine that this is still the case. Perhaps the story now is that there has been some substitution away from new vehicles recently, possibly due to credit constraints, as some used car purchases are cash transactions. Either way, new vehicle prices slipped down 3.1 percent in December.


Click for big

They also discuss the Fed’s gradual easing out of targetted intervention:

Four of the Federal Reserve’s new credit facilities were allowed to expire on February 1. These include the Asset-Backed Commercial Paper Money Market Mutual Fund Liquidity Facility (AMLF), the Commercial Paper Funding Facility (CPFF), the Primary Dealer Credit Facility (PDCF), and the Term Securities Lending Facility (TSLF). As financial market functioning improved, private sources of liquidity became sufficient and the demand for credit via the special facilities diminished. It is important to note that credit extended through these facilities required good collateral backing. Moreover, to limit the use of the facilities, the terms of lending were set to be less attractive than private sources. In this sense, the facilities mimicked the features of the Fed’s Discount Window—a facility available to qualified depositories in normal times.


Click for big

Mind you, the Fed’s balance sheet is still bloated by over a trillion dollars in mortgage paper, so hold off on plans for your end-of-crisis party. Econbrowser‘s James Hamilton provided some perspective in his post Bernanke on the Fed’s balance sheet:


Click for big
Interesting External Papers

BoC Releases Winter 2009-10 Review

The Bank of Canada has released the Bank of Canada Review Winter 2009-2010, with articles:

  • Declining Inflation Persistence in Canada: Causes and Consequences
  • The Evolution of Capital Flows to Emerging-Market Economies
  • Making Bank Notes Accessible for Canadians Living with Blindness or Low Vision

Inflation persistence is defined as

the correlation between current and lagged inflation.

The article concludes that the low level of inflation persistence in Canada will facilitate Price Level Targetting, should be BoC implement such a policy:

For a central bank considering the relative merits of price-level versus inflation targeting, recent research suggests that low structural persistence in inflation will tend to favour the former. Moreover, the transition period to a price-level-targeting regime, when the private sector may still be learning about the precise nature of the change, appears to be less costly when structural infl ation persistence is low.

Interesting External Papers

Boston Fed Examines Fair Value Accounting and Asset Fire Sales

The Federal Reserve Bank of Boston has released a working paper by Sanders Shaffer titled Fair Value Accounting: Villain or Innocent Victim: Exploring the Links between Fair Value Accounting, Bank Regulatory Capital and the Recent Financial Crisis:

There is a popular belief that the confluence of bank capital rules and fair value accounting helped trigger the recent financial crisis. The claim is that questionable valuations of long term investments based on prices obtained from illiquid markets created a pro-cyclical effect whereby mark to market adjustments reduced regulatory capital forcing banks to sell off investments which further depressed prices. This ultimately led to bank instability and the credit effects that reached a peak late in 2008. This paper analyzes a sample of large banks to attempt to measure the strength of the link between fair value accounting, regulatory capital rules, pro-cyclicality and financial contagion. The focus is on large banks because they value a significant portion of their balance sheets using fair value. They also hold investment portfolios that contain illiquid assets in large enough volumes to possibly affect the market in a pro-cyclical fashion. The analysis is based on a review of recent historical financial data. The analysis does not reveal a clear link for most banks in the sample, but rather suggests that there may have been other more significant factors putting stress on bank regulatory capital.

After a discussion of Fair Value Accounting and the criticism that has been leveled against it, the author points out:

Fair value is applied to investment securities depending on how they are classified. Investment securities classified as available for sale are measured at fair value each reporting period. The resulting adjustments are termed unrealized gains or losses. These adjustments are recorded in an equity account called Accumulated Other Comprehensive Income. An important point here is that fair value adjustments related to debt securities and unrealized gains on equity securities are excluded when computing Tier 1 regulatory capital.

The author hypothesizes:

This analysis does not address whether raising capital through the sale of investments in a distressed market would be a first choice or last resort. However, one may be able to infer that if banks were actually being forced into distressed sales, they would first try to reduce more discretionary items. Dividends on common stock are discretionary and can be reduced or suspended as a method to maintain capital ratios.

Further, it does not appear that losses were realized in practice:

To summarize, this analysis looked at the largest financial institutions. It then isolated the impacts that critics have linked to capital destruction, namely the application of fair value to banks’ investment portfolios. The analysis shows that the impact on regulatory capital was quite small and does not appear to be large enough to be considered the driver of the pro-cyclical dynamic whereby declining asset prices lead to lower capital, then on to sales of assets to replenish capital, creating further pressure on prices and so on. In addition, there was no evidence found in reported financial data which would be indicative of distressed selling activity during the crisis period of 2008.

So if mark-to-market wasn’t the villain, what was?:

Based on further analysis of 2008 financial results, it was noted that loan loss provision had a significant impact on regulatory capital for most institutions in the sample.

An example is supplied:

At the height of the crisis, State Street stock fell 59 percent in one day when it was announced that unrealized losses had doubled, and analysts noted that TCE was approaching zero based on pro-forma calculations that added in the impact of consolidating certain off-balance sheet investment conduit programs.

The Simple TCE Ratio is calculated as STCE/tangible assets. Tangible assets = total assets – goodwill – intangible assets (excluding Mortgage Servicing Rights). It is not known how much emphasis was placed on TCE versus other significant factors that were also affecting bank stocks at the same time. That being said, State Street and BNYM are two possible examples in this analysis where fair value accounting may have contributed to bank instability based on the significant affect on TCE. It should be noted though that State Street and BNYM did not sell investment assets in response to capital depletion or market stress. They were able to rely on debt and equity issuances as well as participation in government capital programs. So although fair value may have contributed to some instability, the link between fair value and pro-cyclicality did not necessarily come to fruition here, at least partially due to government intervention.

The author concludes:

Based on this simple analysis it would appear that fair value accounting had a minimal impact on the capital of most banks in the sample during the crisis period through the end of 2008. Capital destruction was due to deterioration in loan portfolios and was further depleted by items such as proprietary trading losses and common stock dividends. These are a result of lending practices and the actions of bank management, not accounting rules. Furthermore, the data suggests that banks were not raising significant capital through distressed asset sales; rather they were relying on government programs as well as debt and equity markets.

This paper is of particular interest given the recent BoC Paper on Systemic Capital Requirements and its concern regarding the contagion effect of Asset Fire Sales.