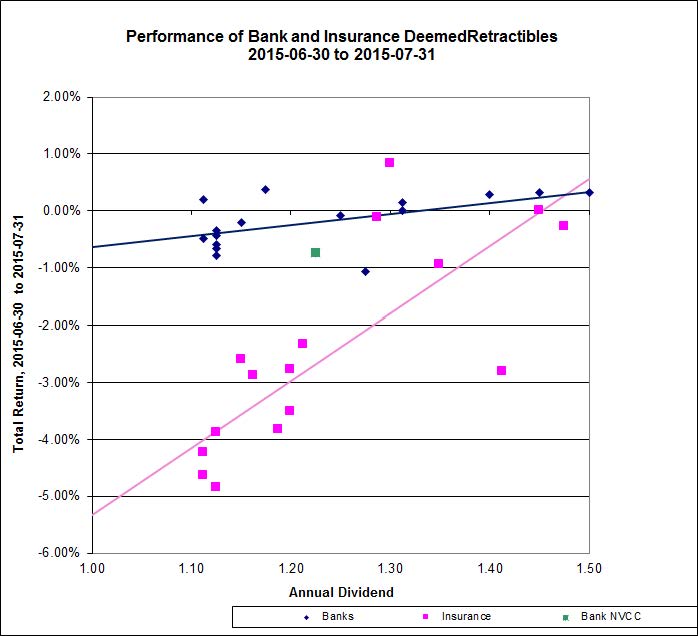
As noted in MAPF Portfolio Composition: August 2015, the fund now has a large allocation to FixedResets, mostly of relatively low spread.
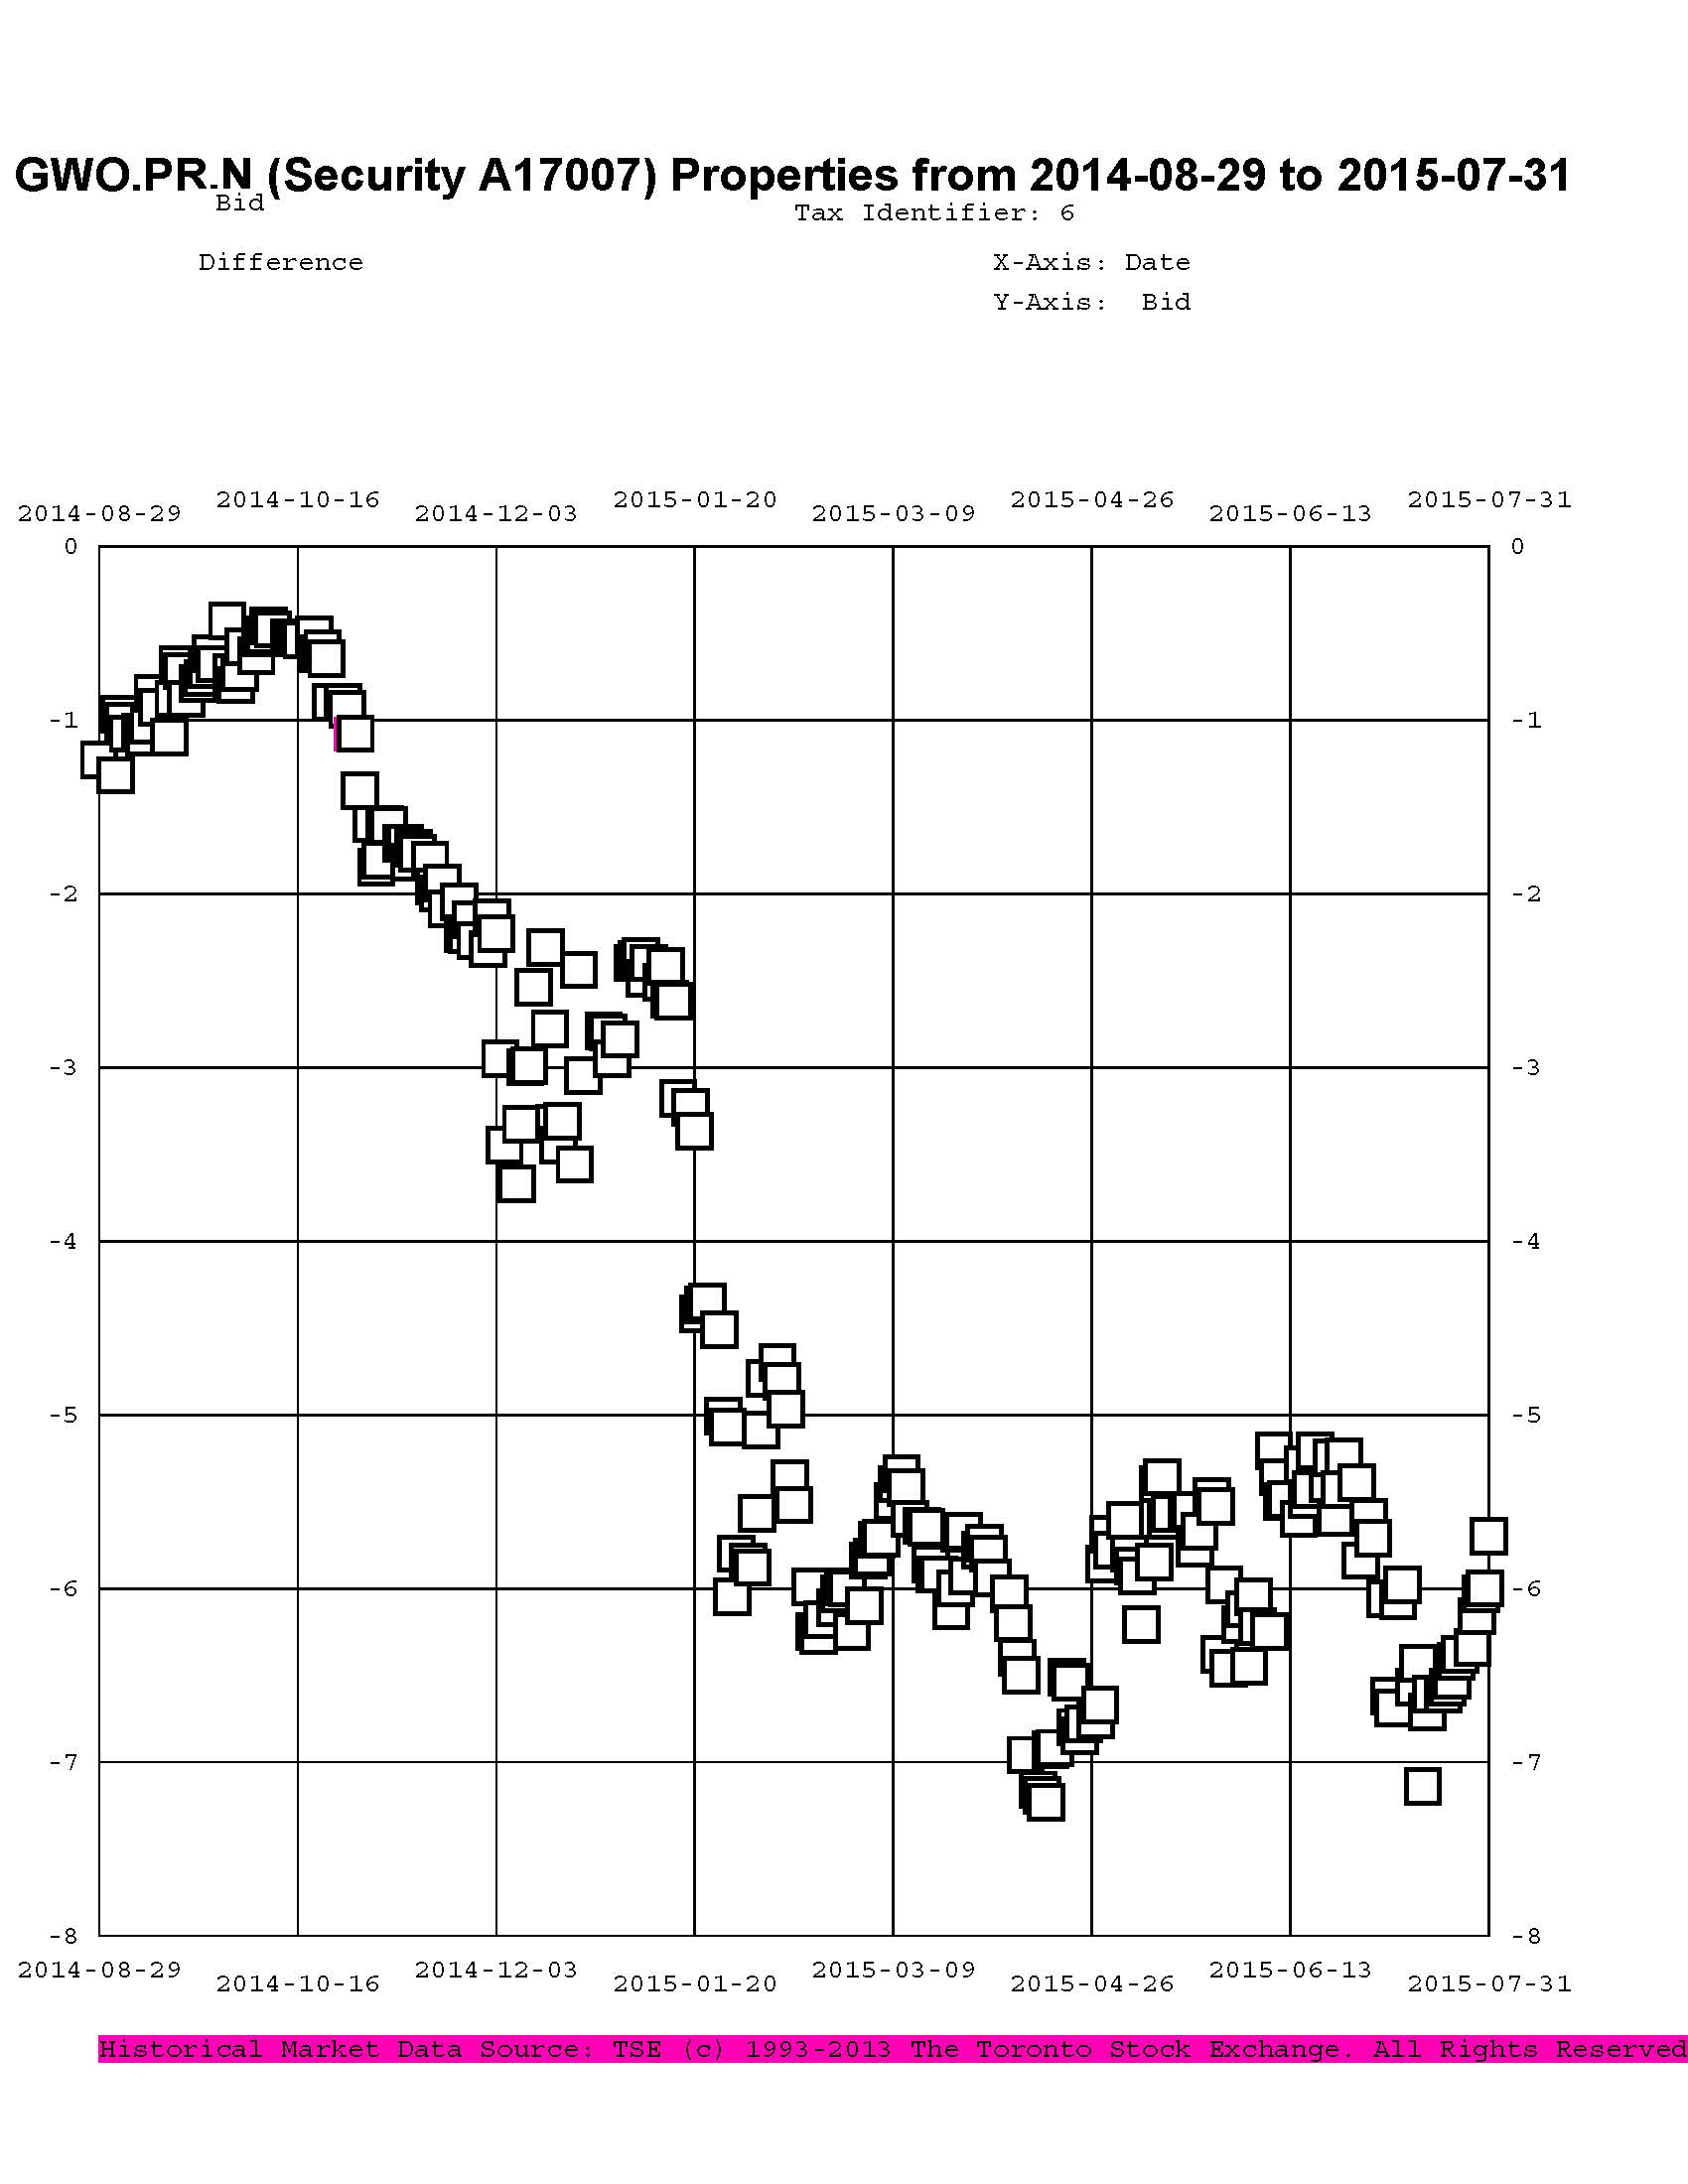
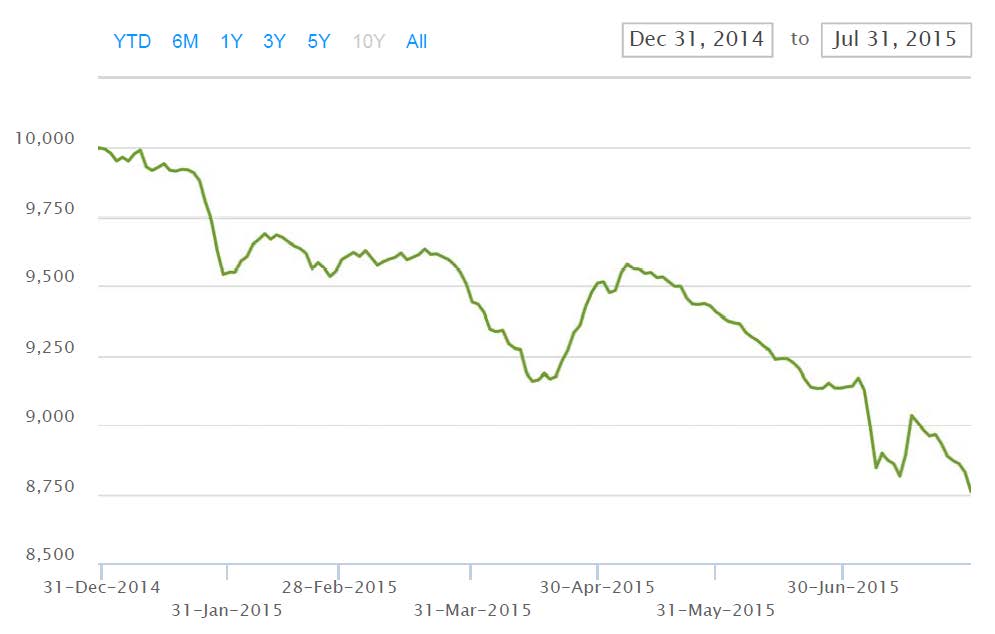
Many of these were largely purchased with proceeds of sales of DeemedRetractibles from the same issuer; it is interesting to look at the price trend of some of the Straight/FixedReset pairs. We’ll start with GWO.PR.N / GWO.PR.I; the fund sold the latter to buy the former at a takeout of about $1.00 in mid-June, 2014; relative prices over the past year are plotted as:
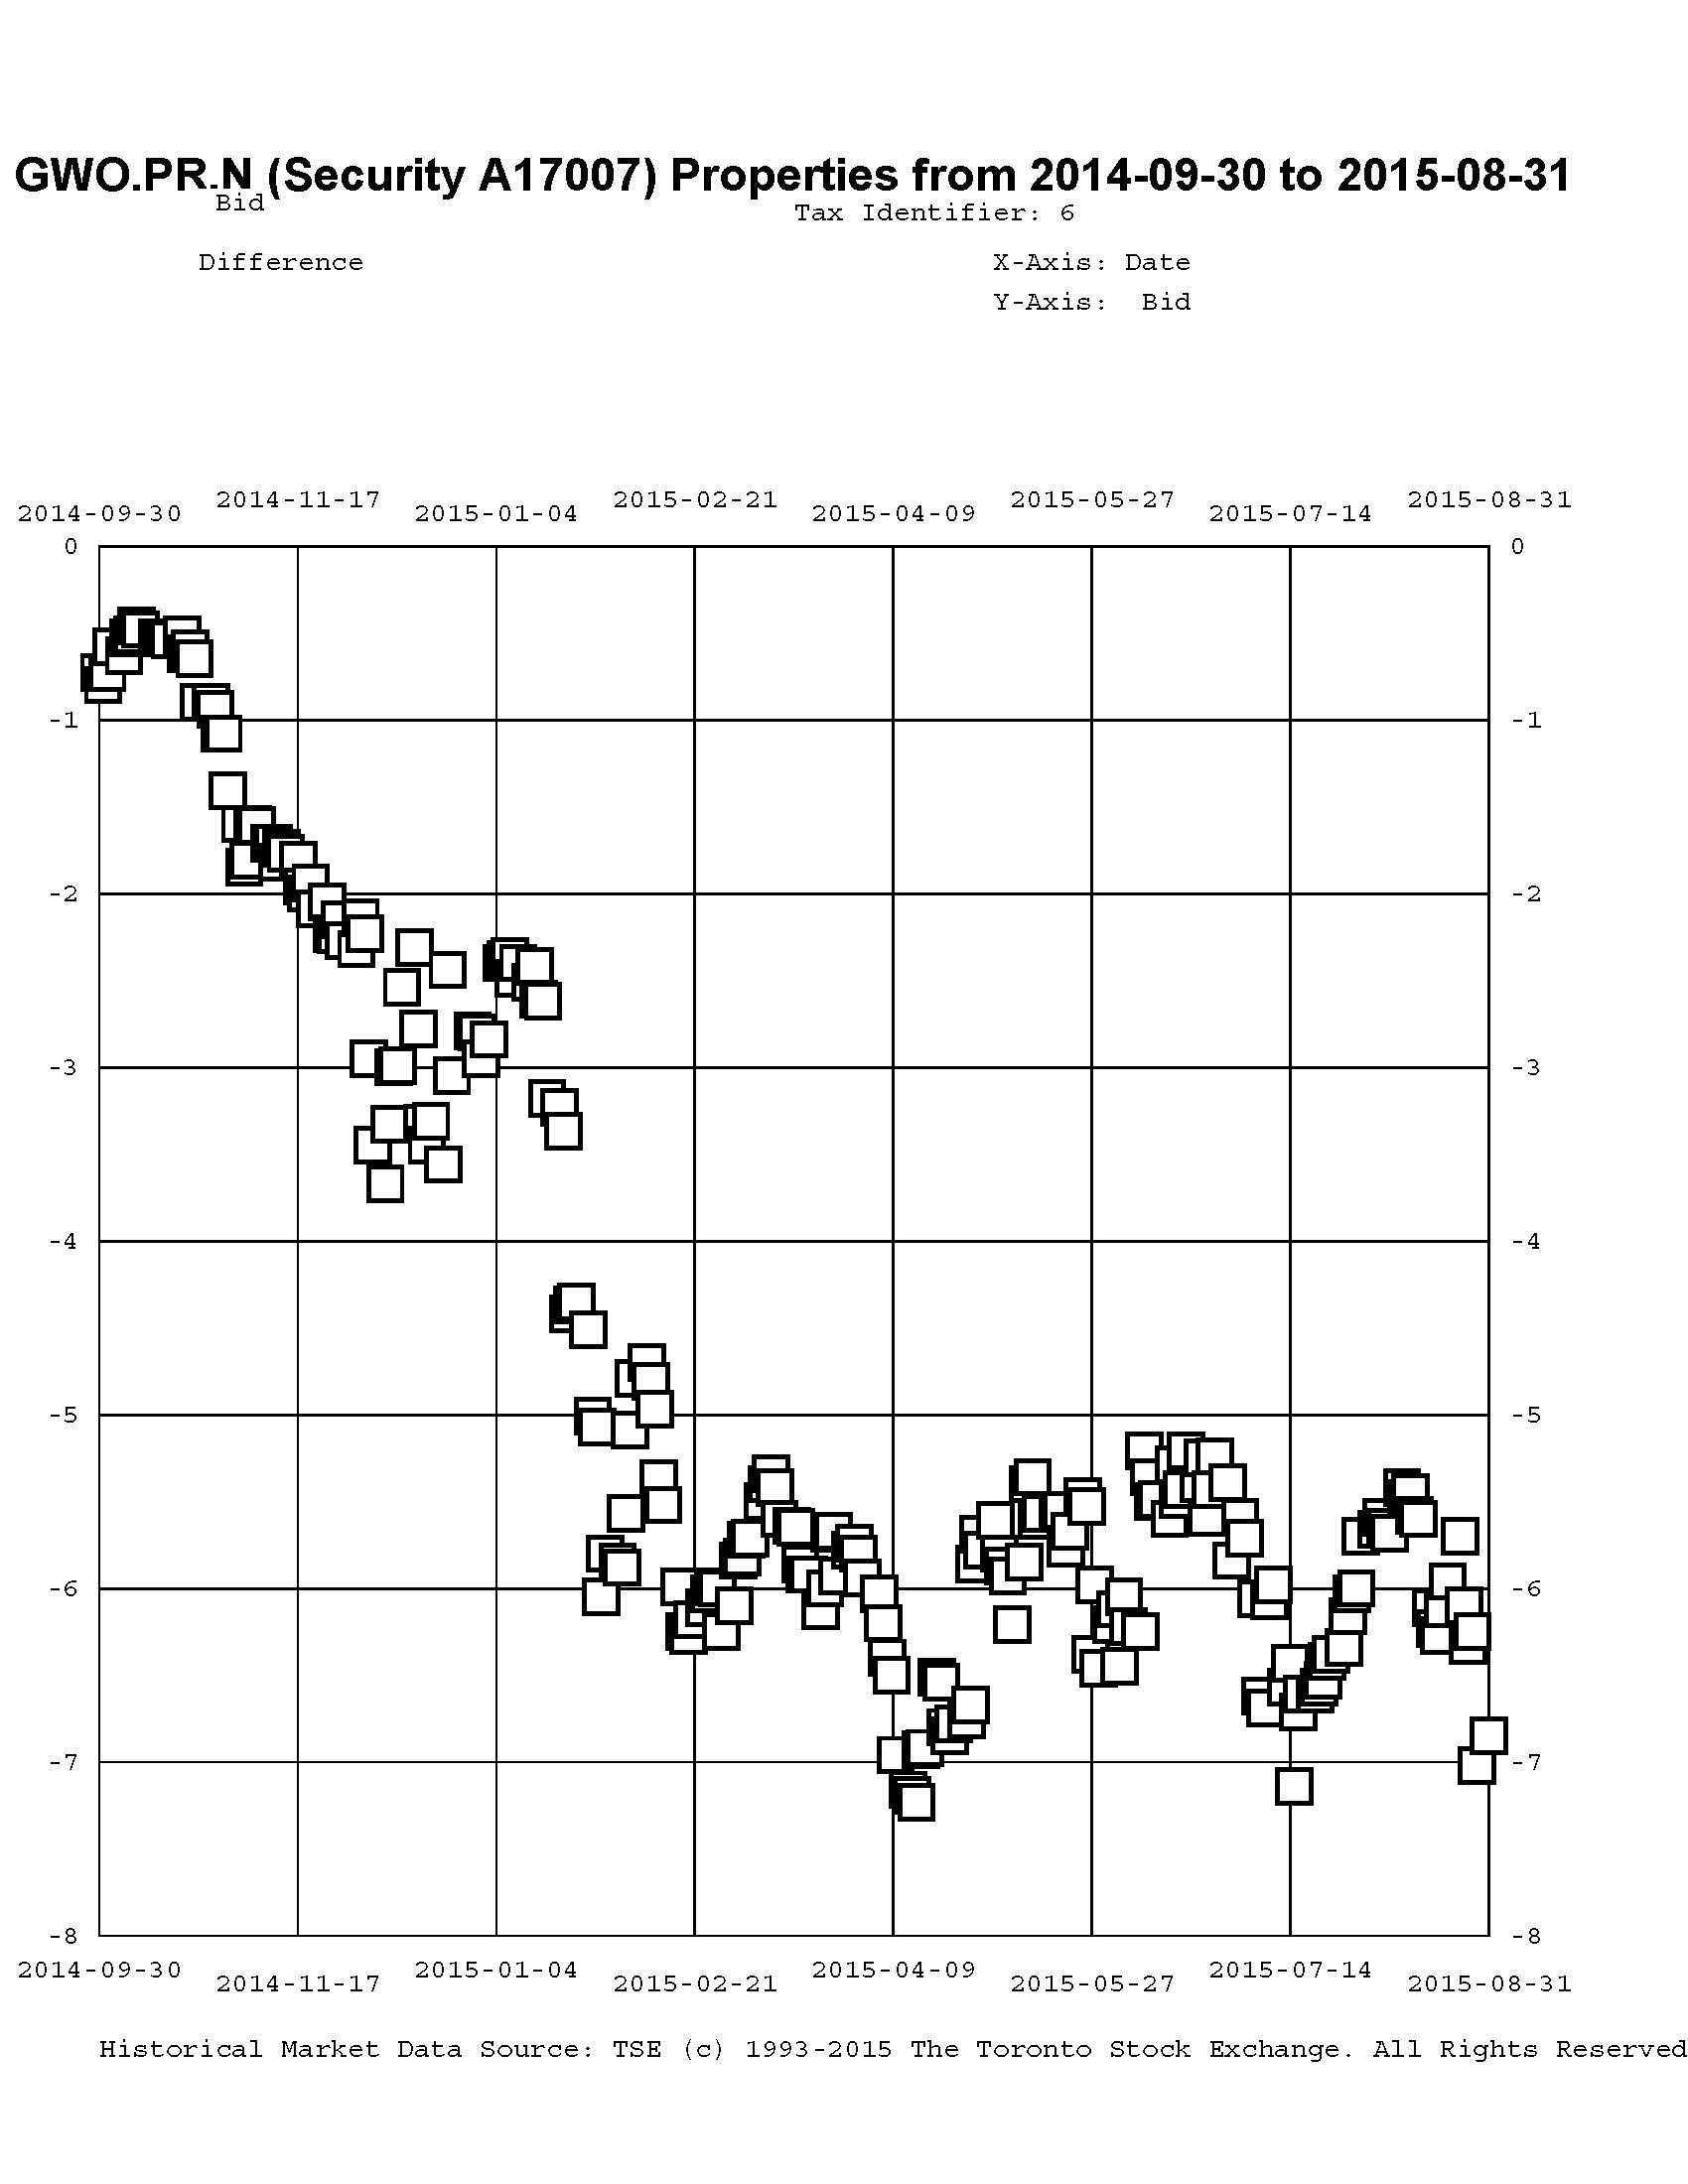
Click for Big
Given that the August month-end take-out was $6.85, this is clearly a trade that has not worked out very well.
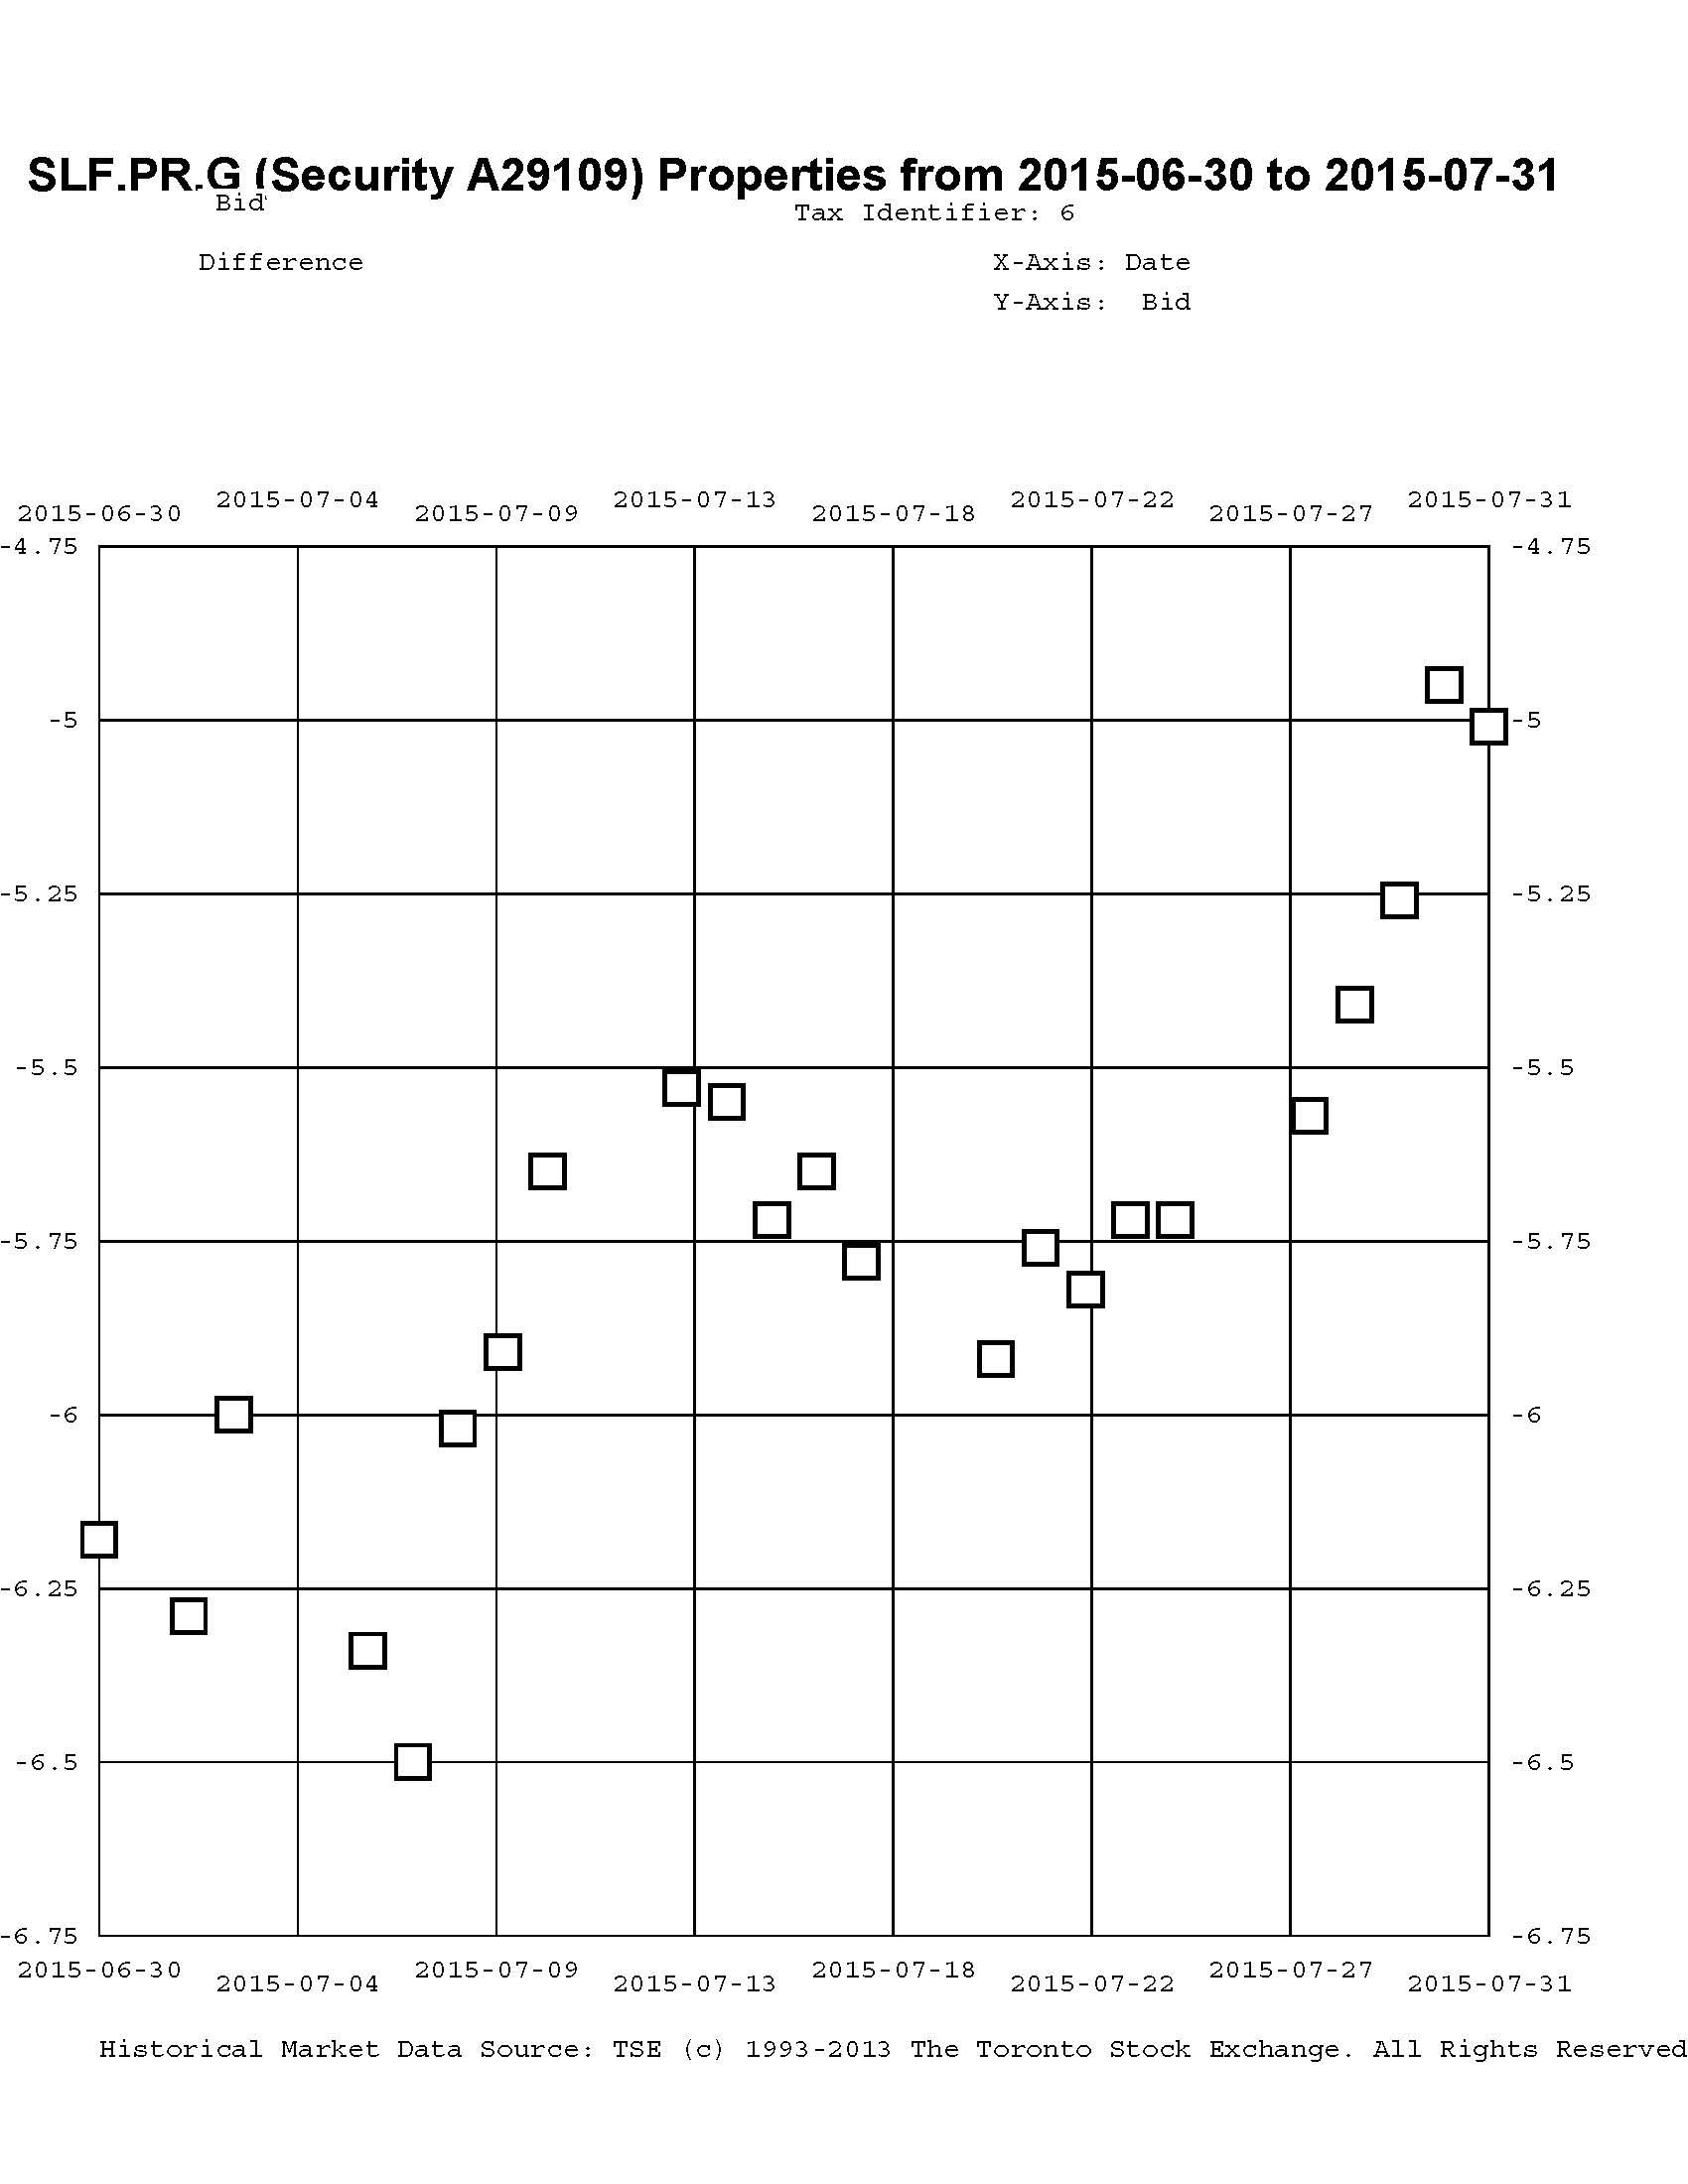
In July, 2014, I reported sales of SLF.PR.D to purchase SLF.PR.G at a take-out of about $0.15:
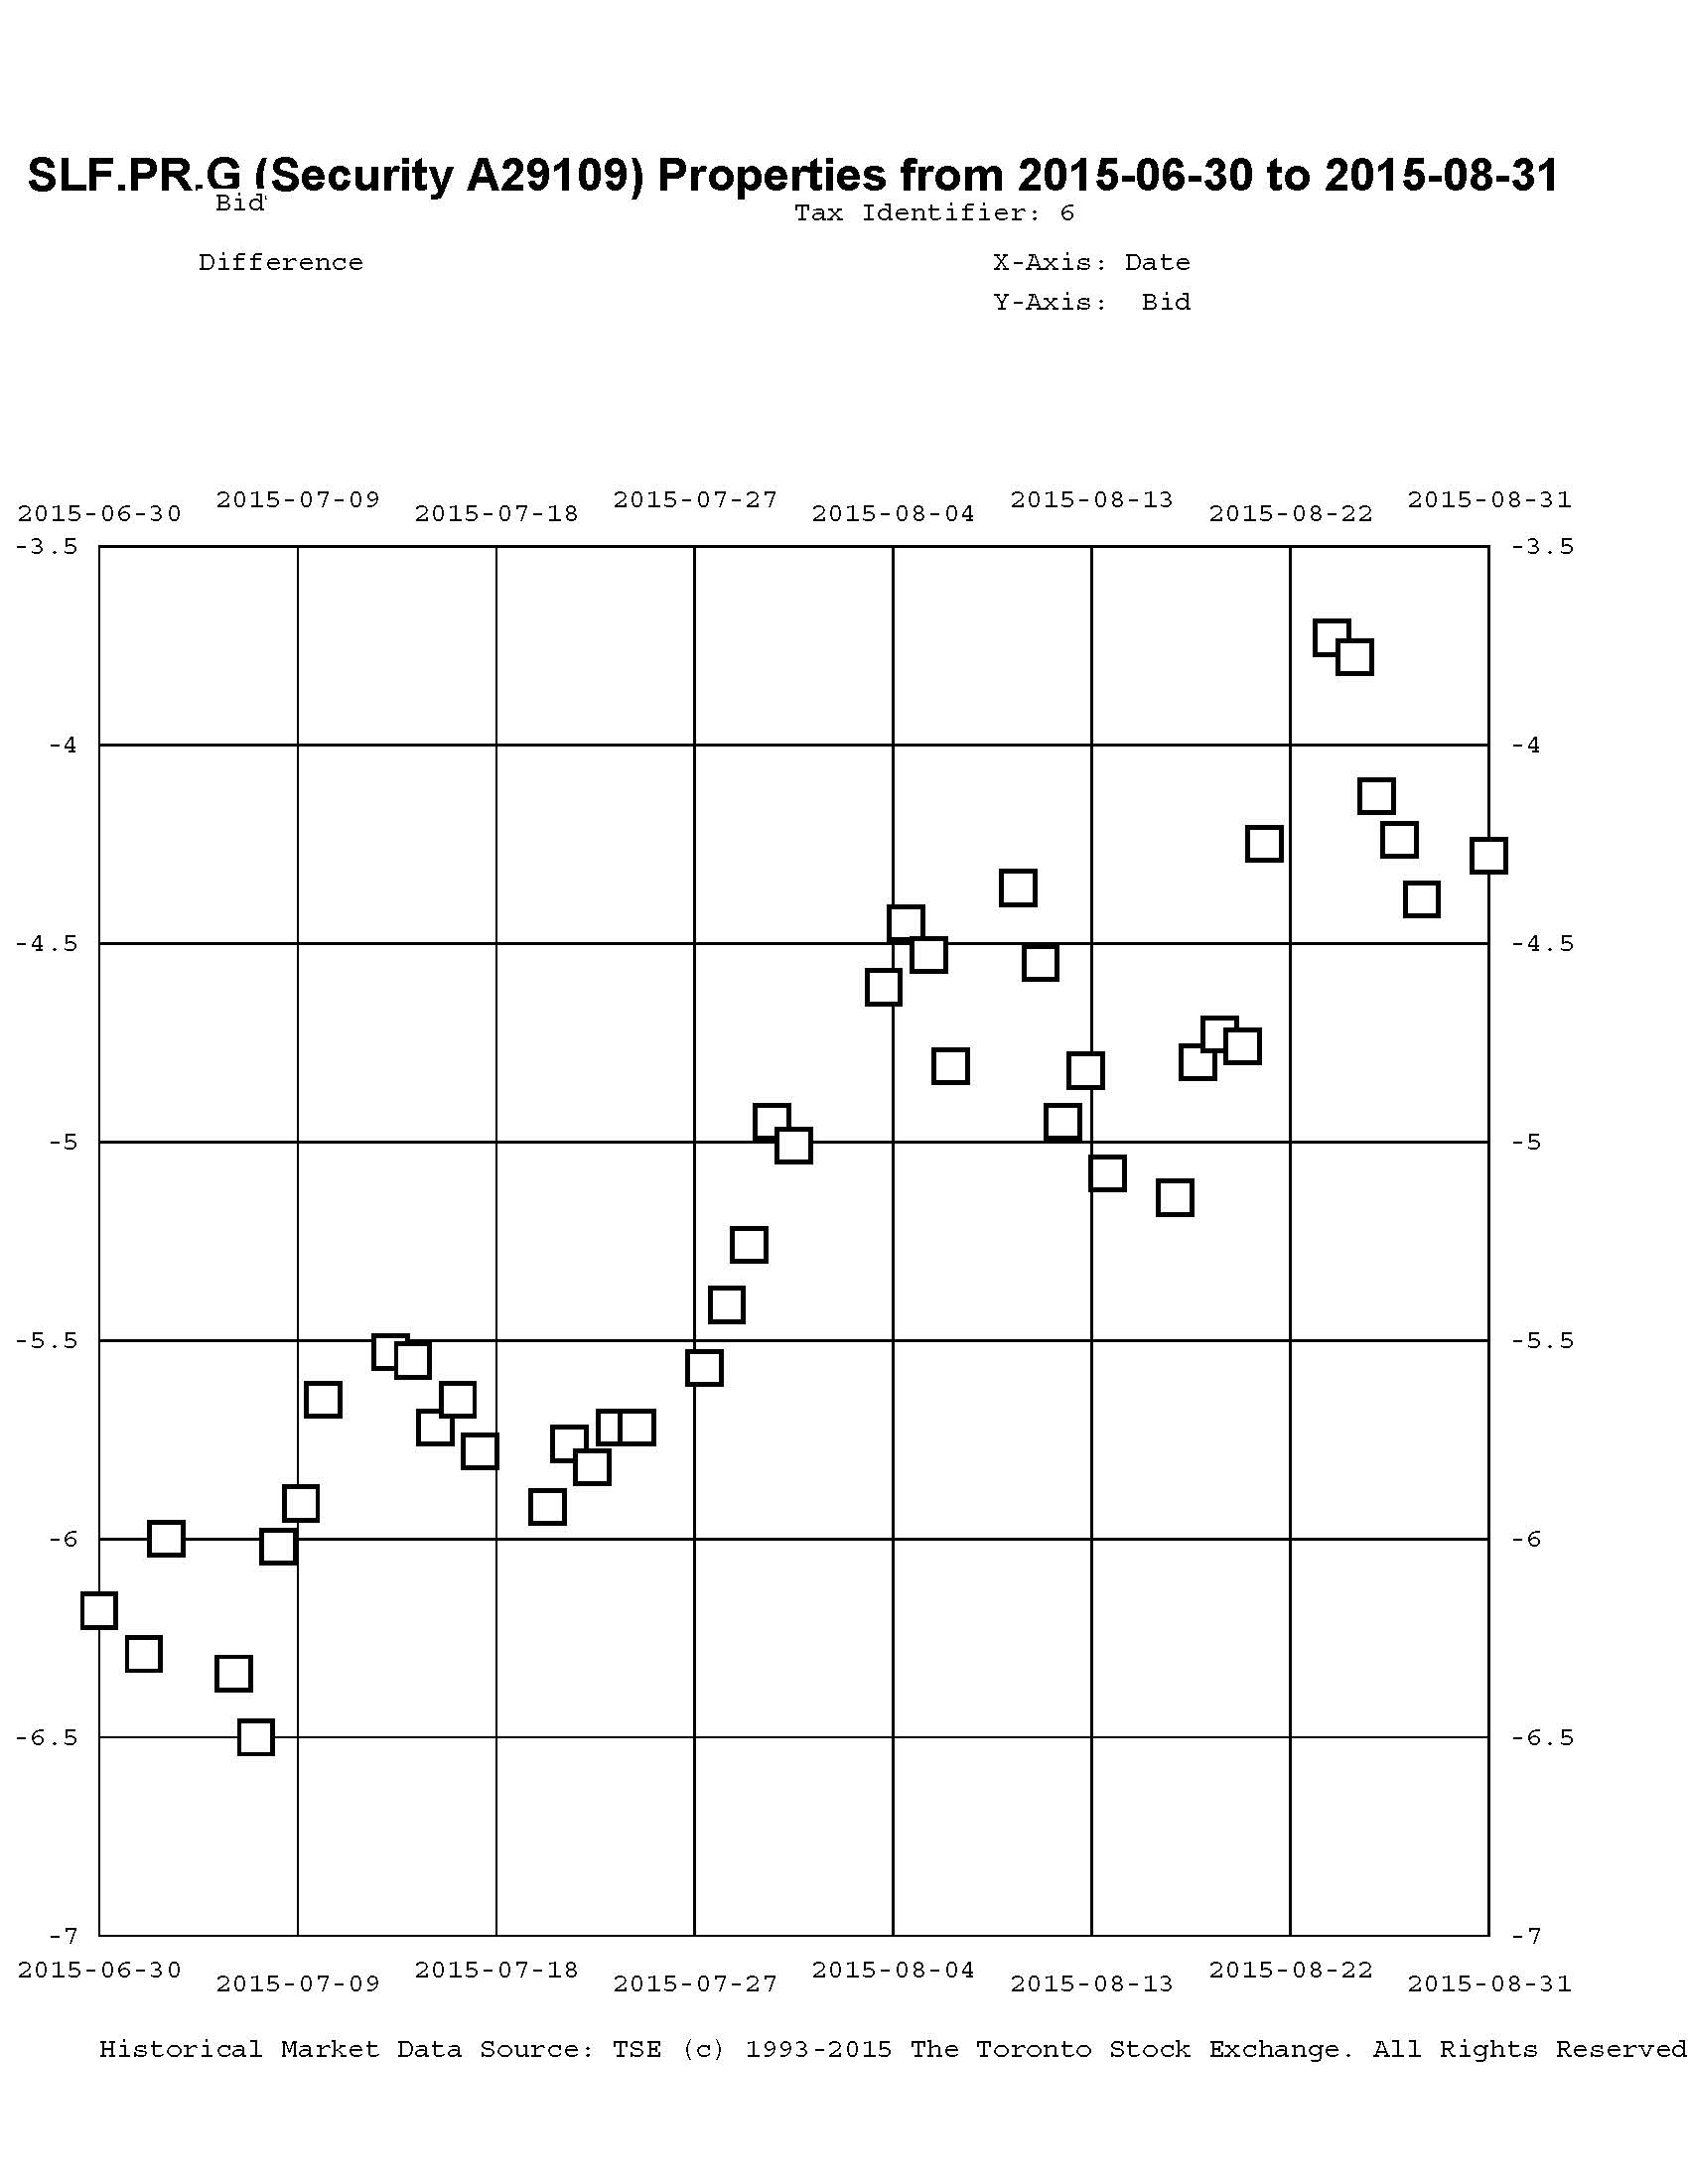
Click for Big
There were similar trades in August, 2014 (from SLF.PR.C) at a take-out of $0.35. The August month-end take-out (bid price SLF.PR.D less bid price SLF.PR.G) was $4.28, so that hasn’t worked very well either.
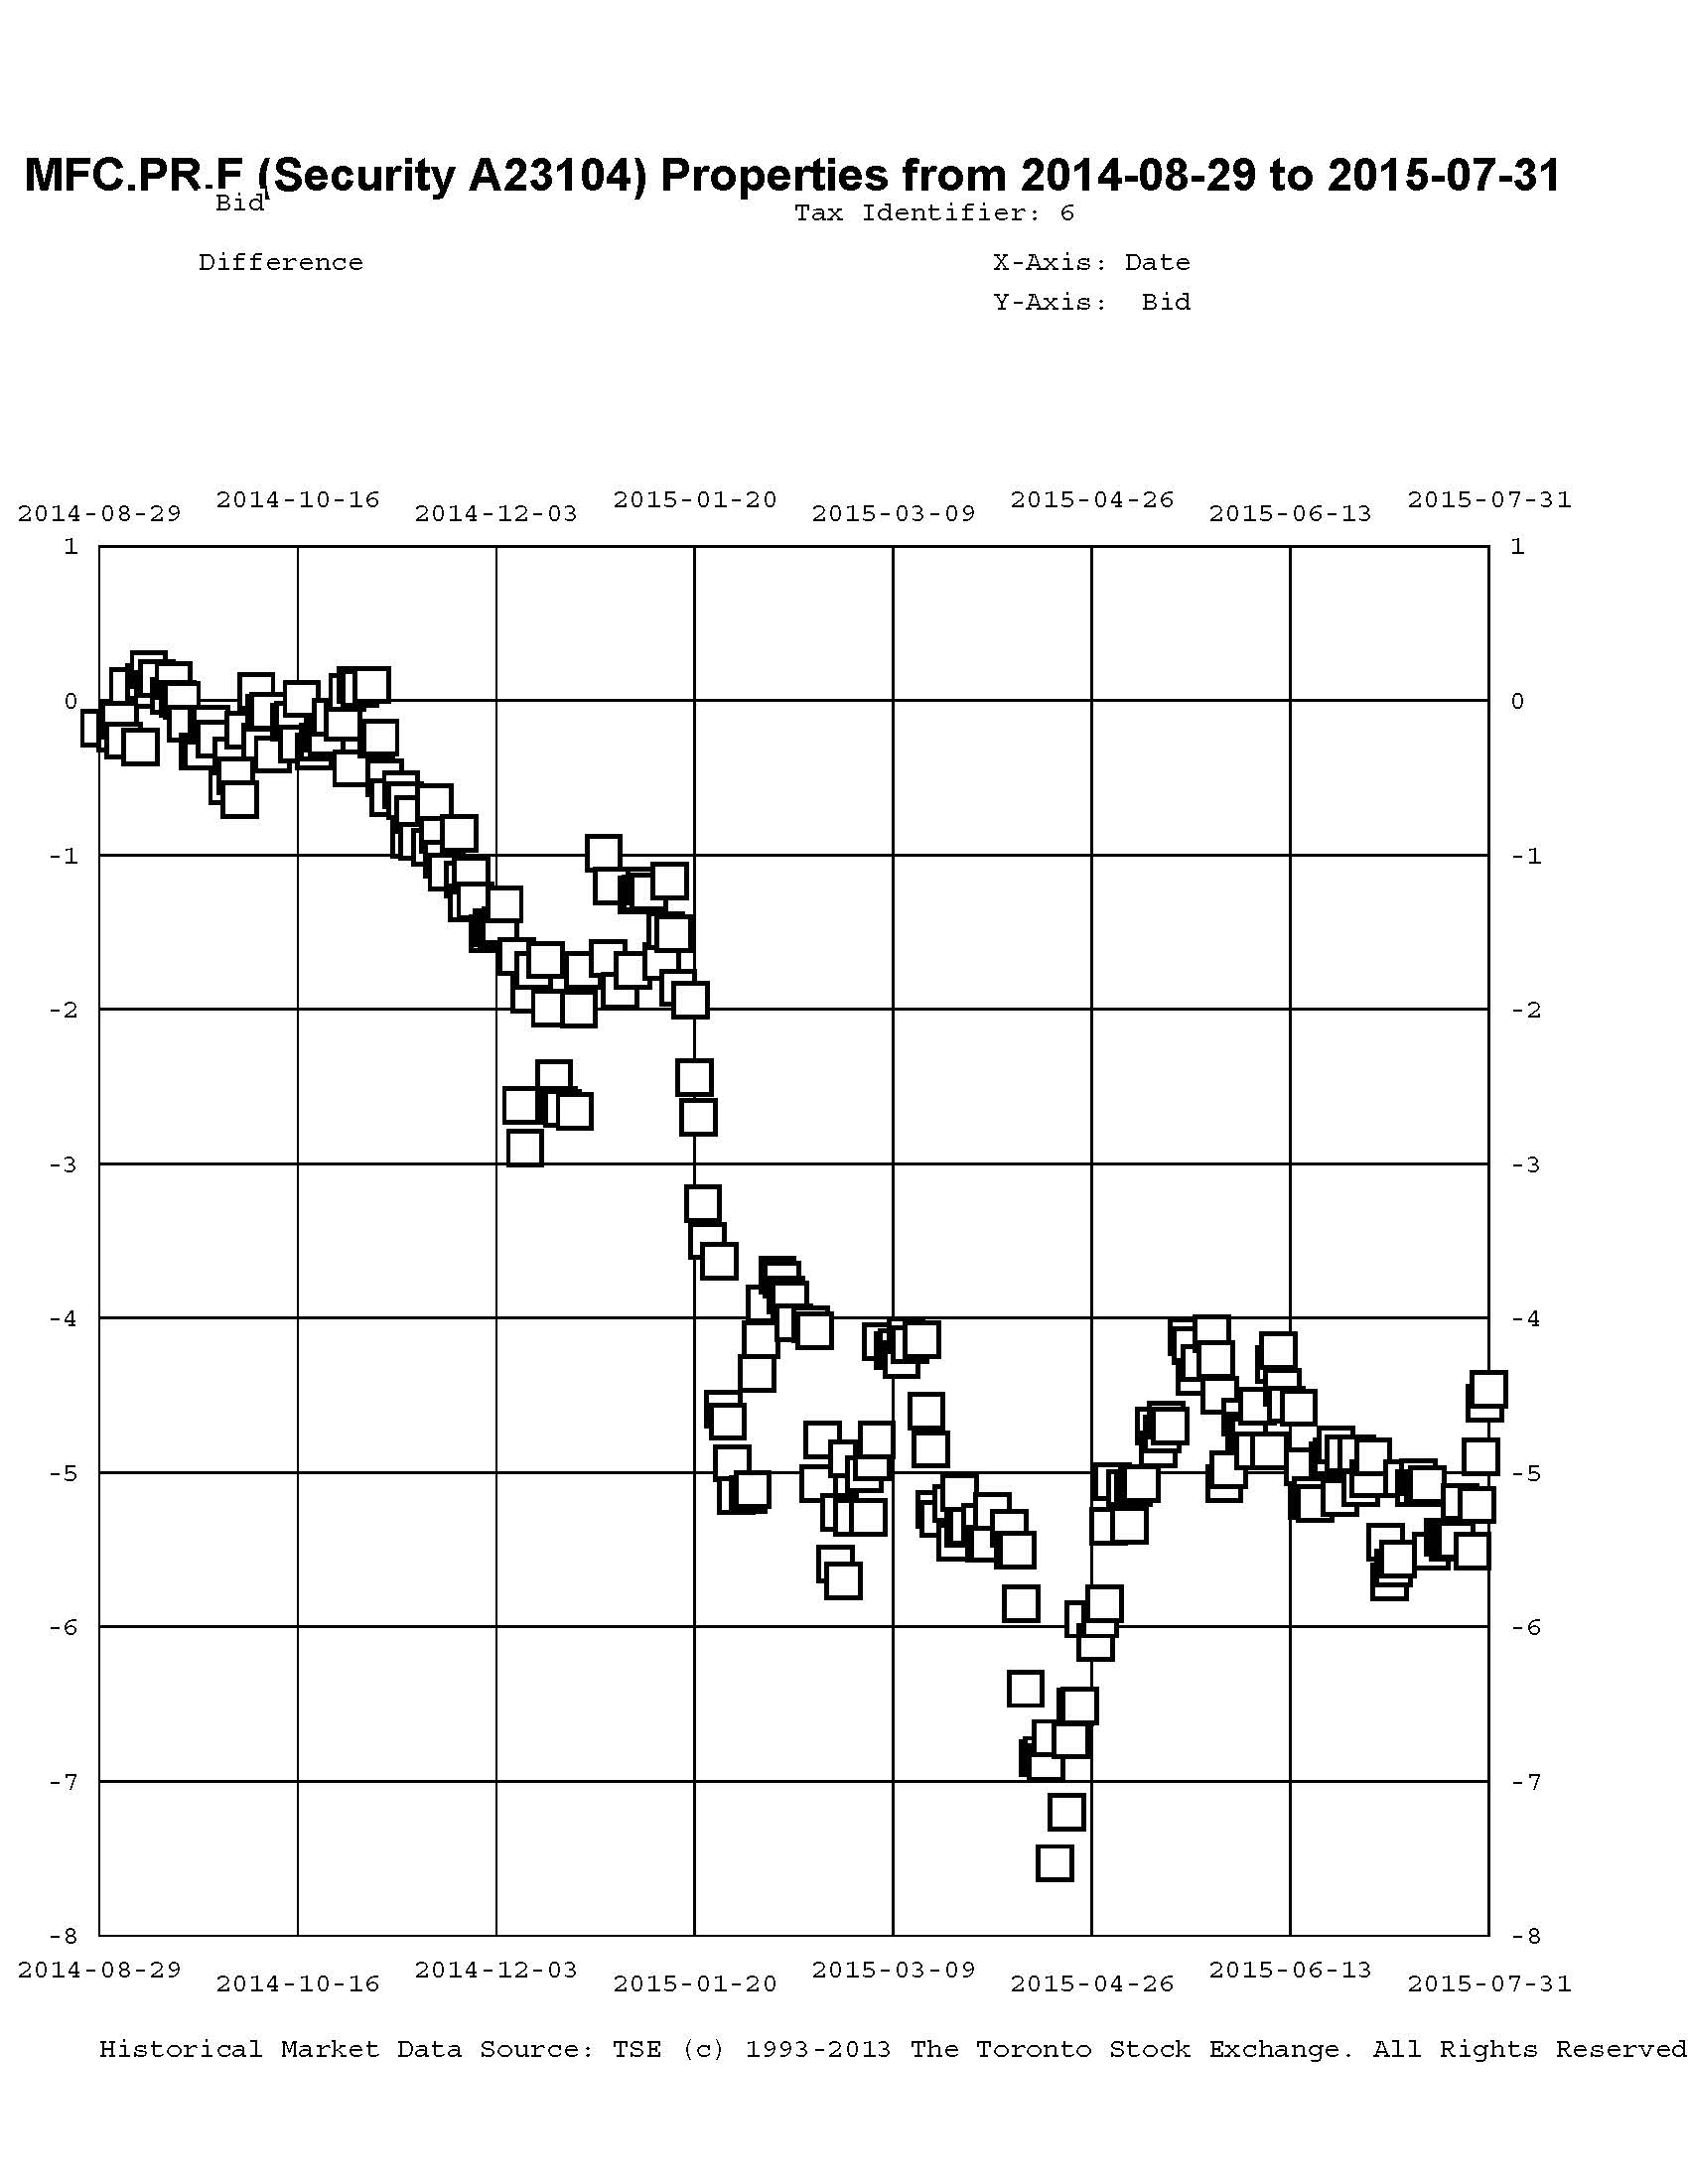
November saw the third insurer-based sector swap, as the fund sold MFC.PR.C to buy the FixedReset MFC.PR.F at a post-dividend-adjusted take-out of about $0.85 … given an August month-end take-out of $4.88, that’s another regrettable trade, although another piece executed in December at a take-out of $1.57 has less badly.
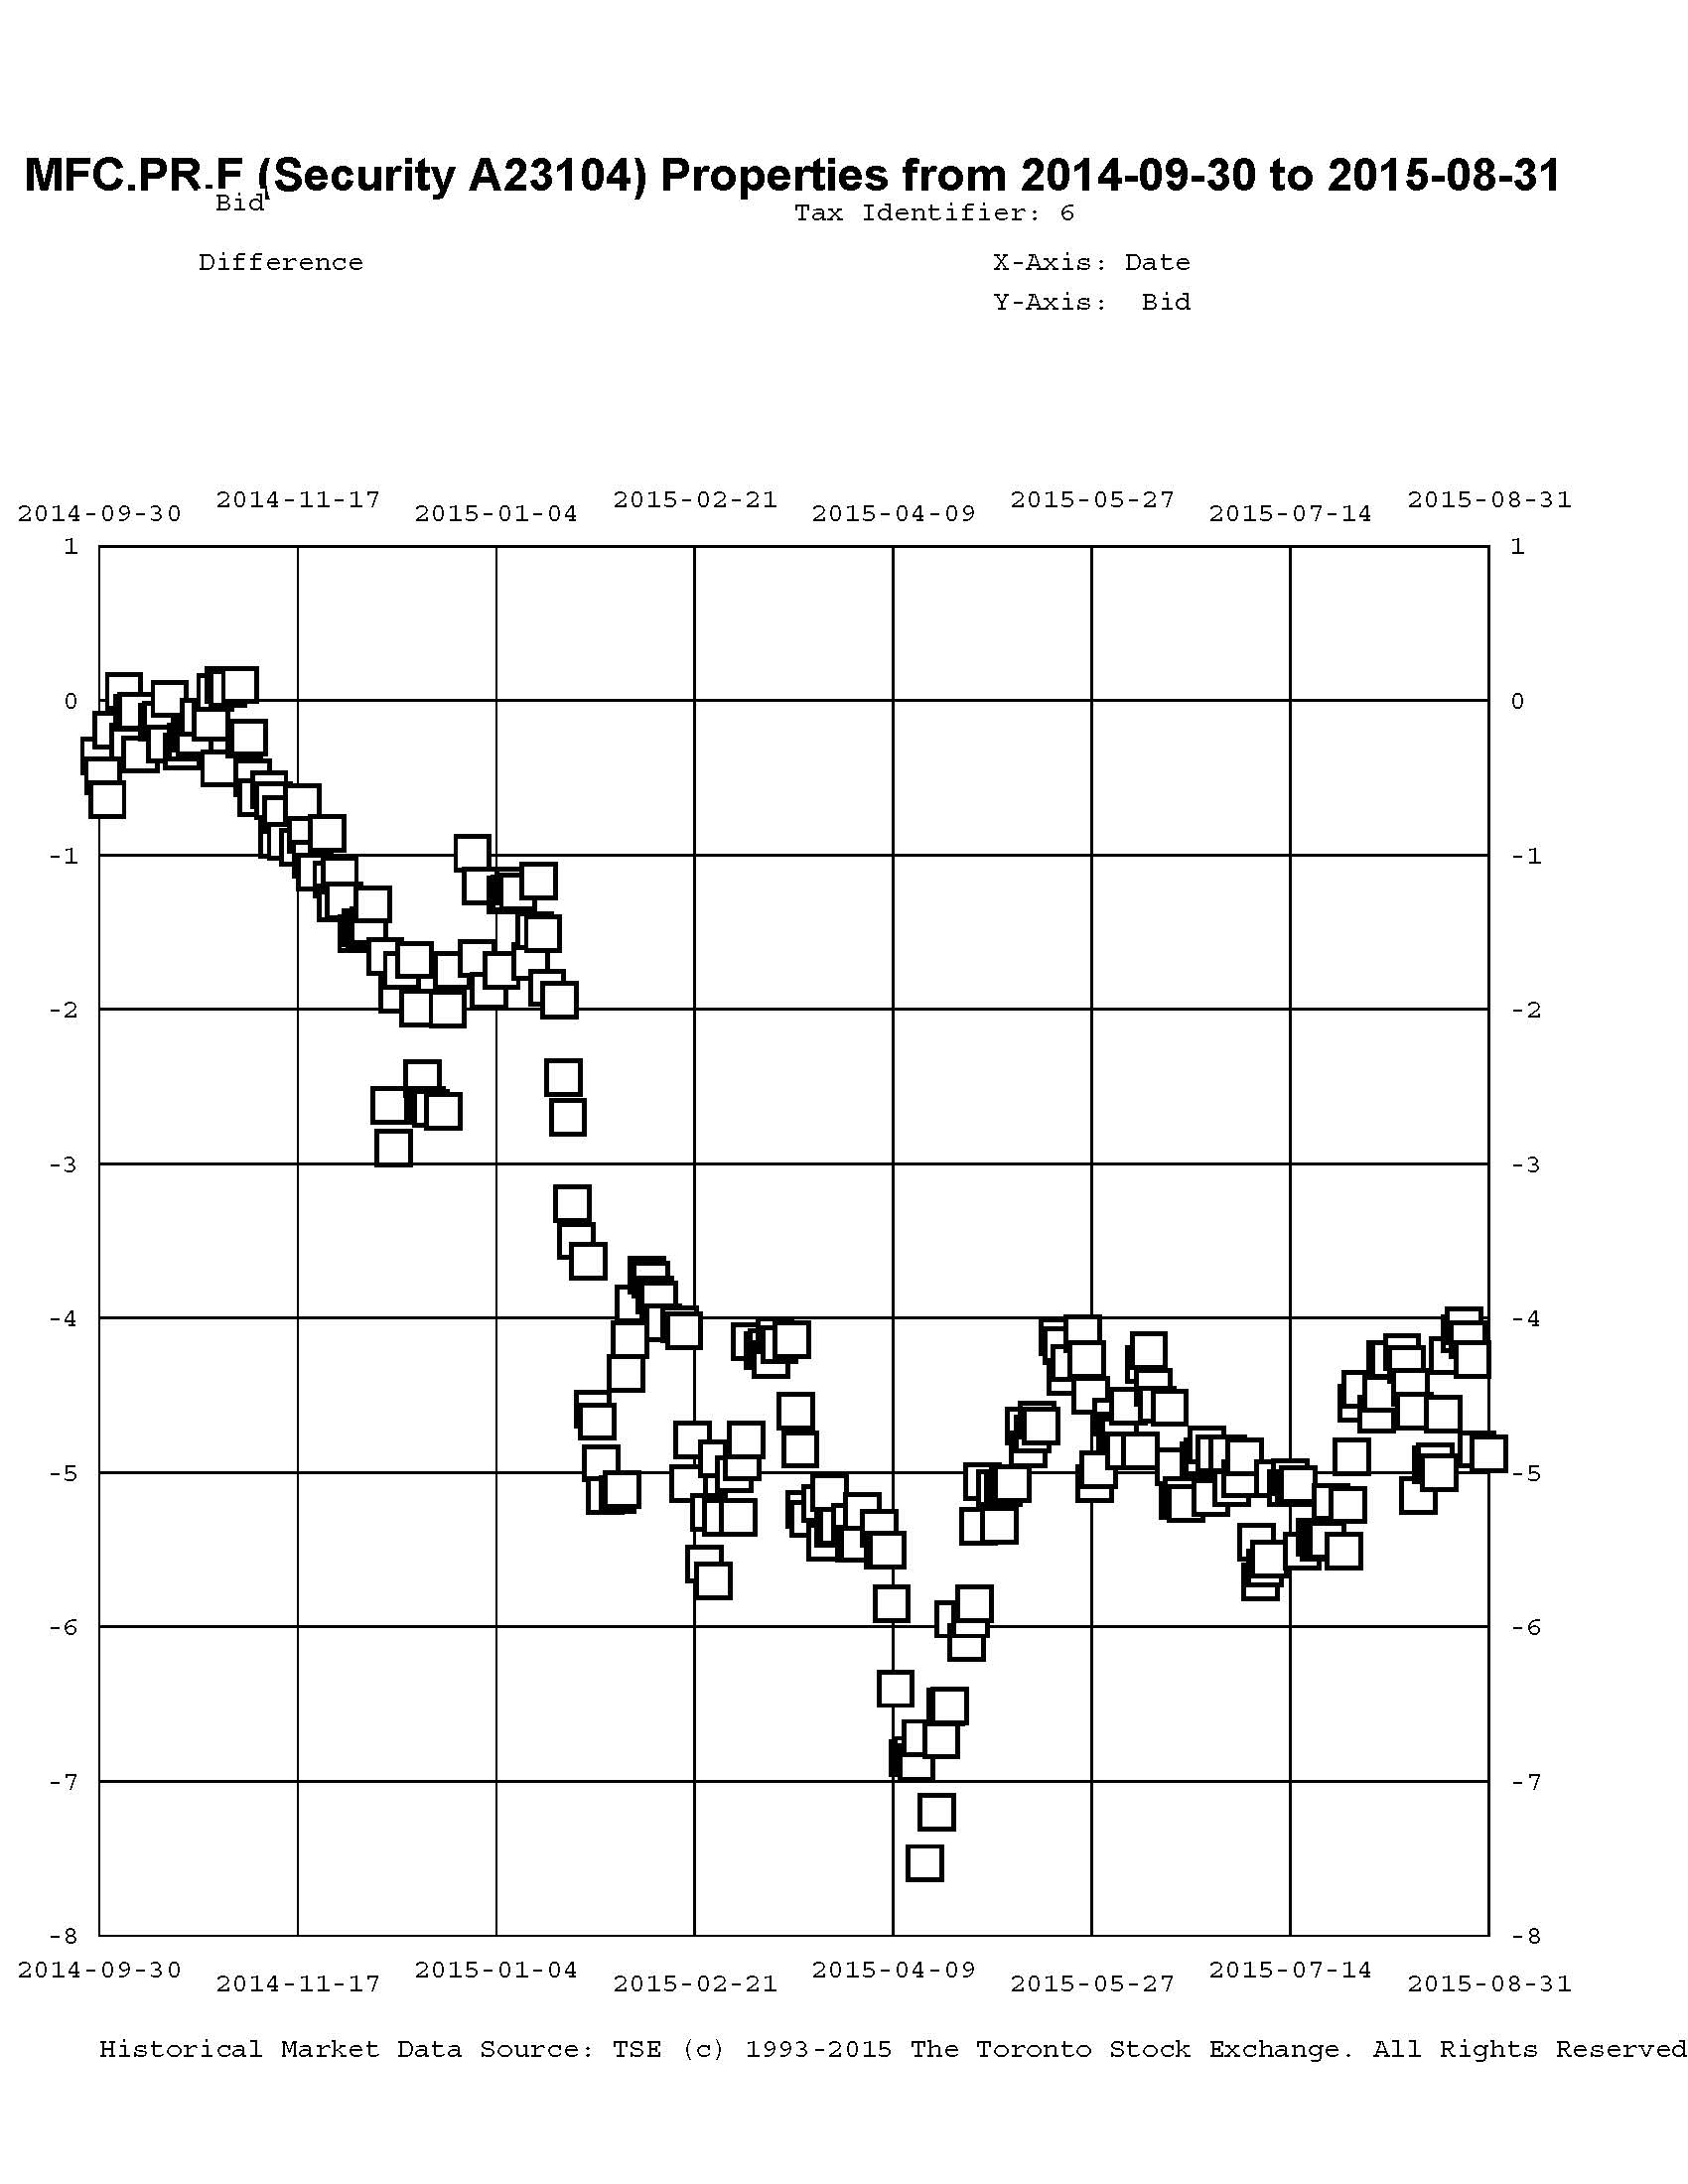
Click for Big
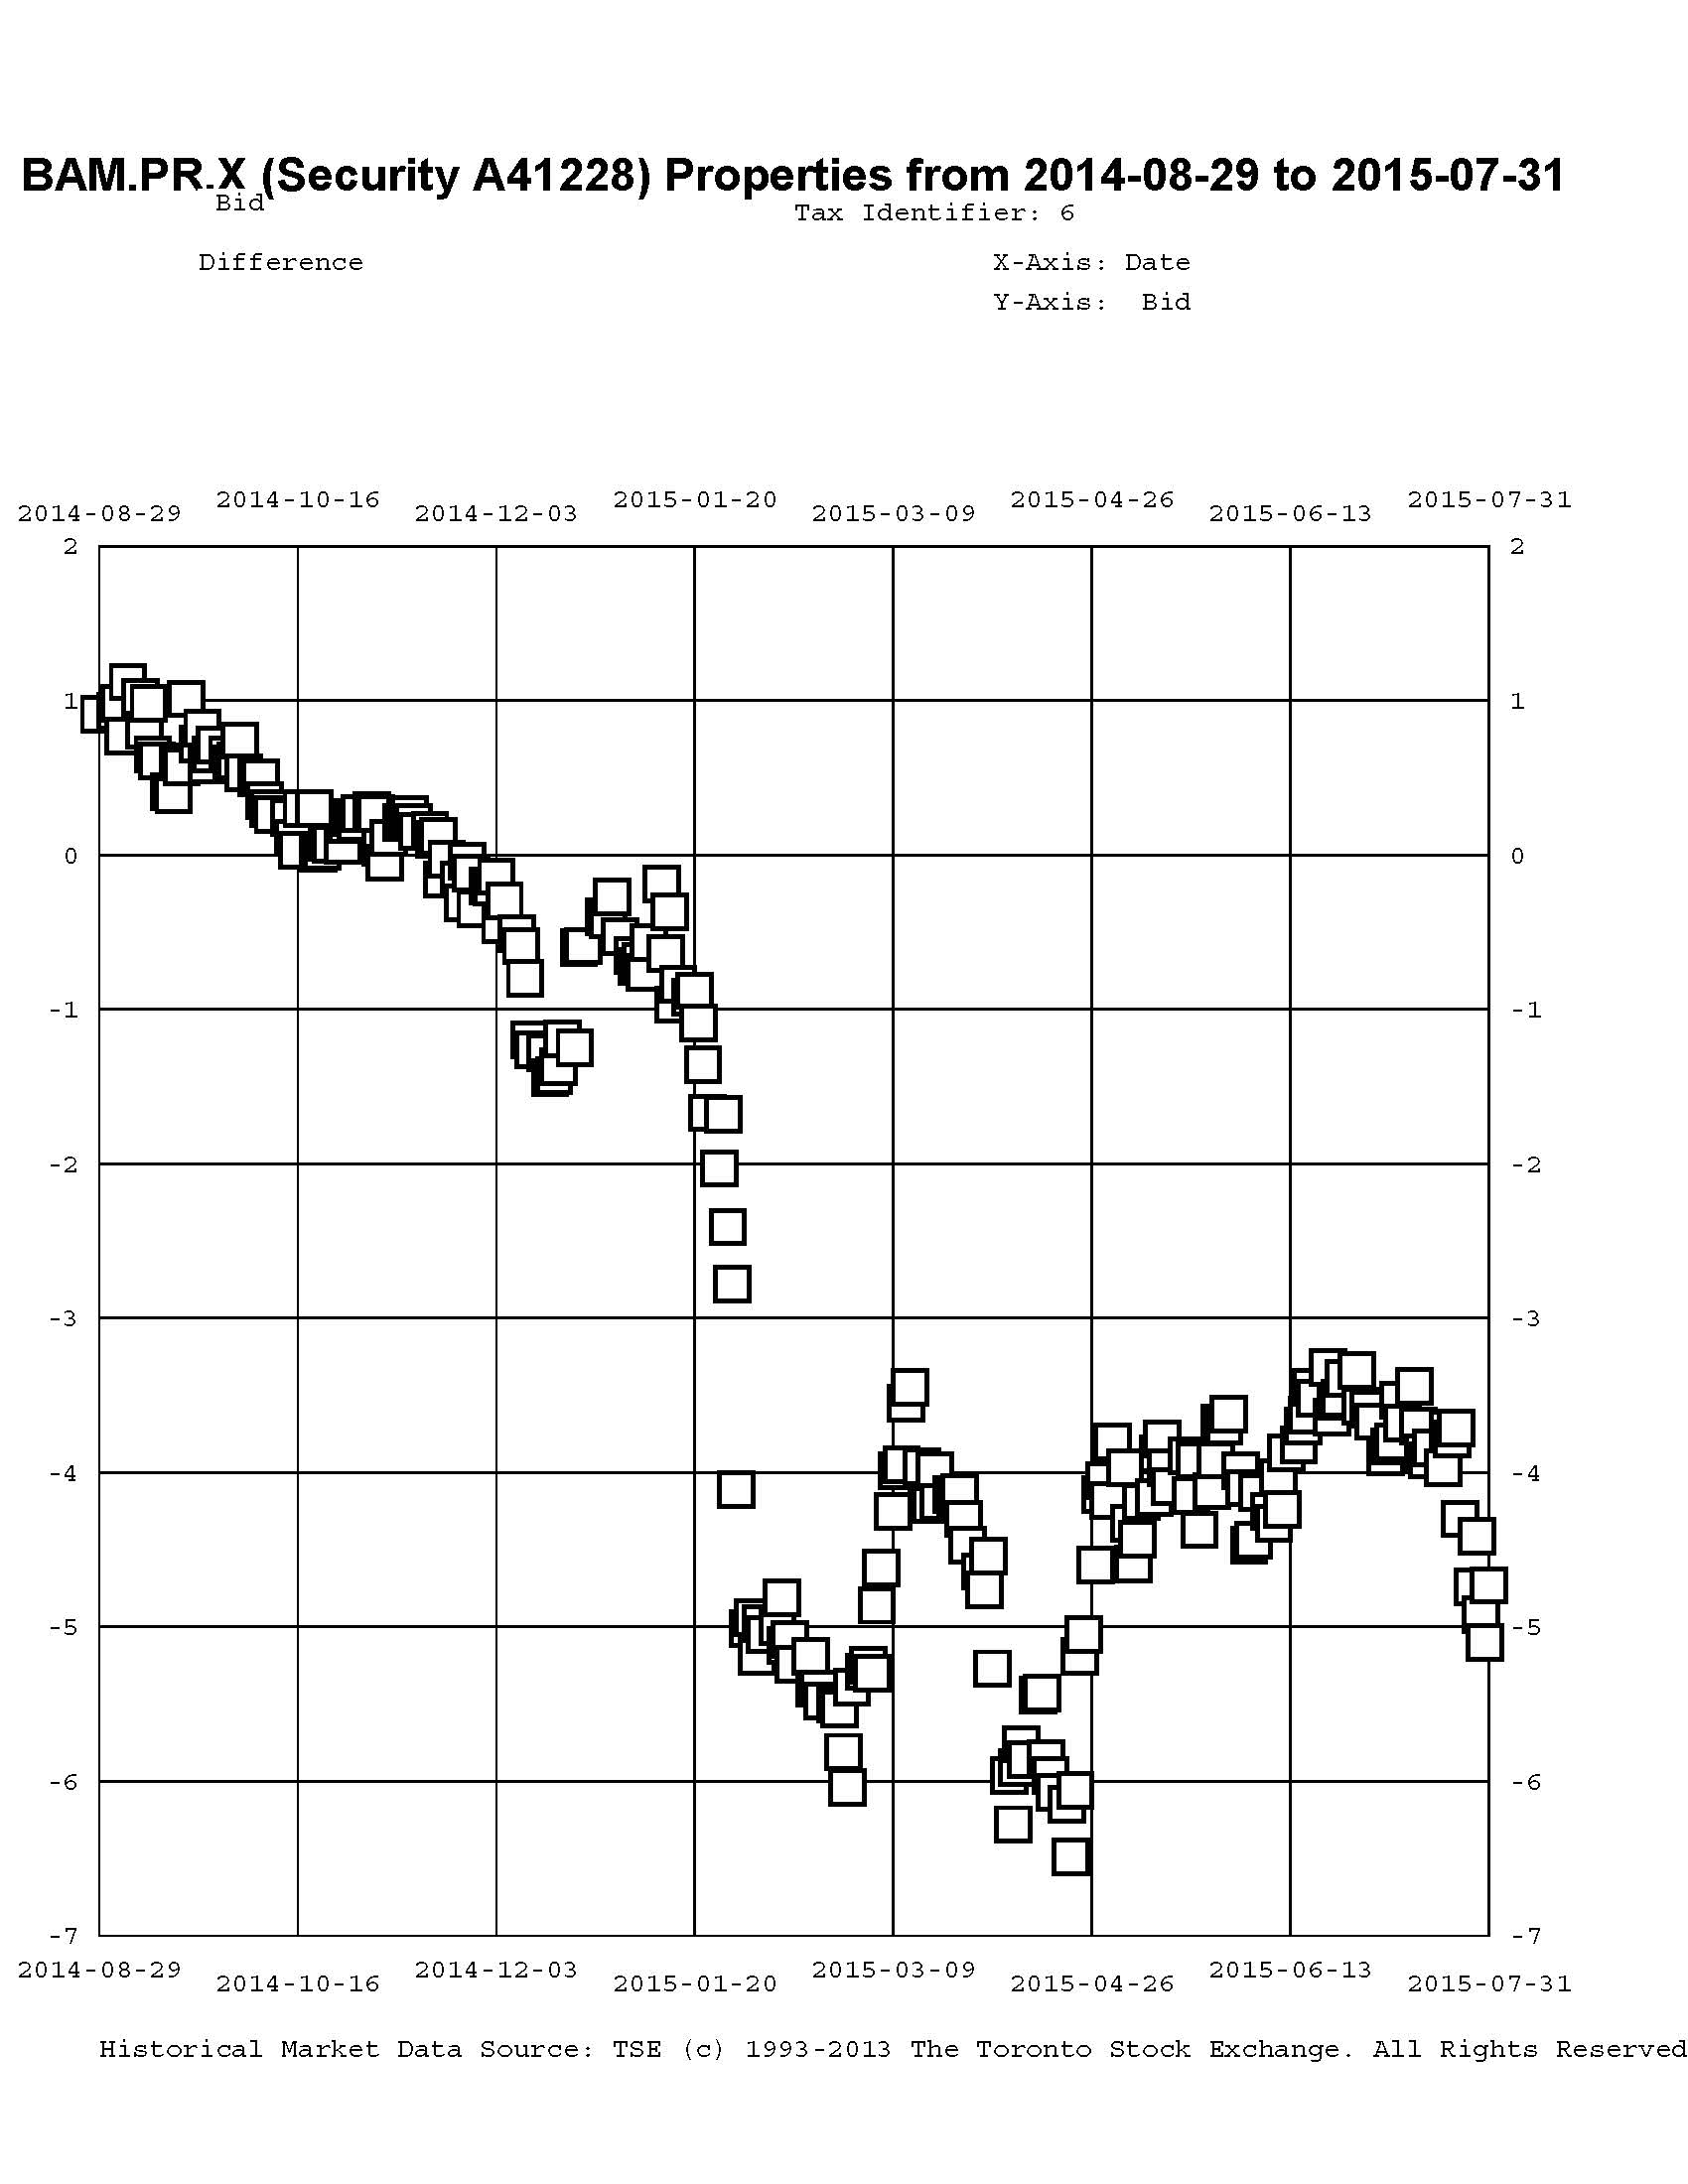
This trend is not restricted to the insurance sector, which I expect will become subject to NVCC rules in the relatively near future and are thus subject to the same redemption assumptions I make for DeemedRetractibles. Other pairs of interest are BAM.PR.X / BAM.PR.N:

Click for Big
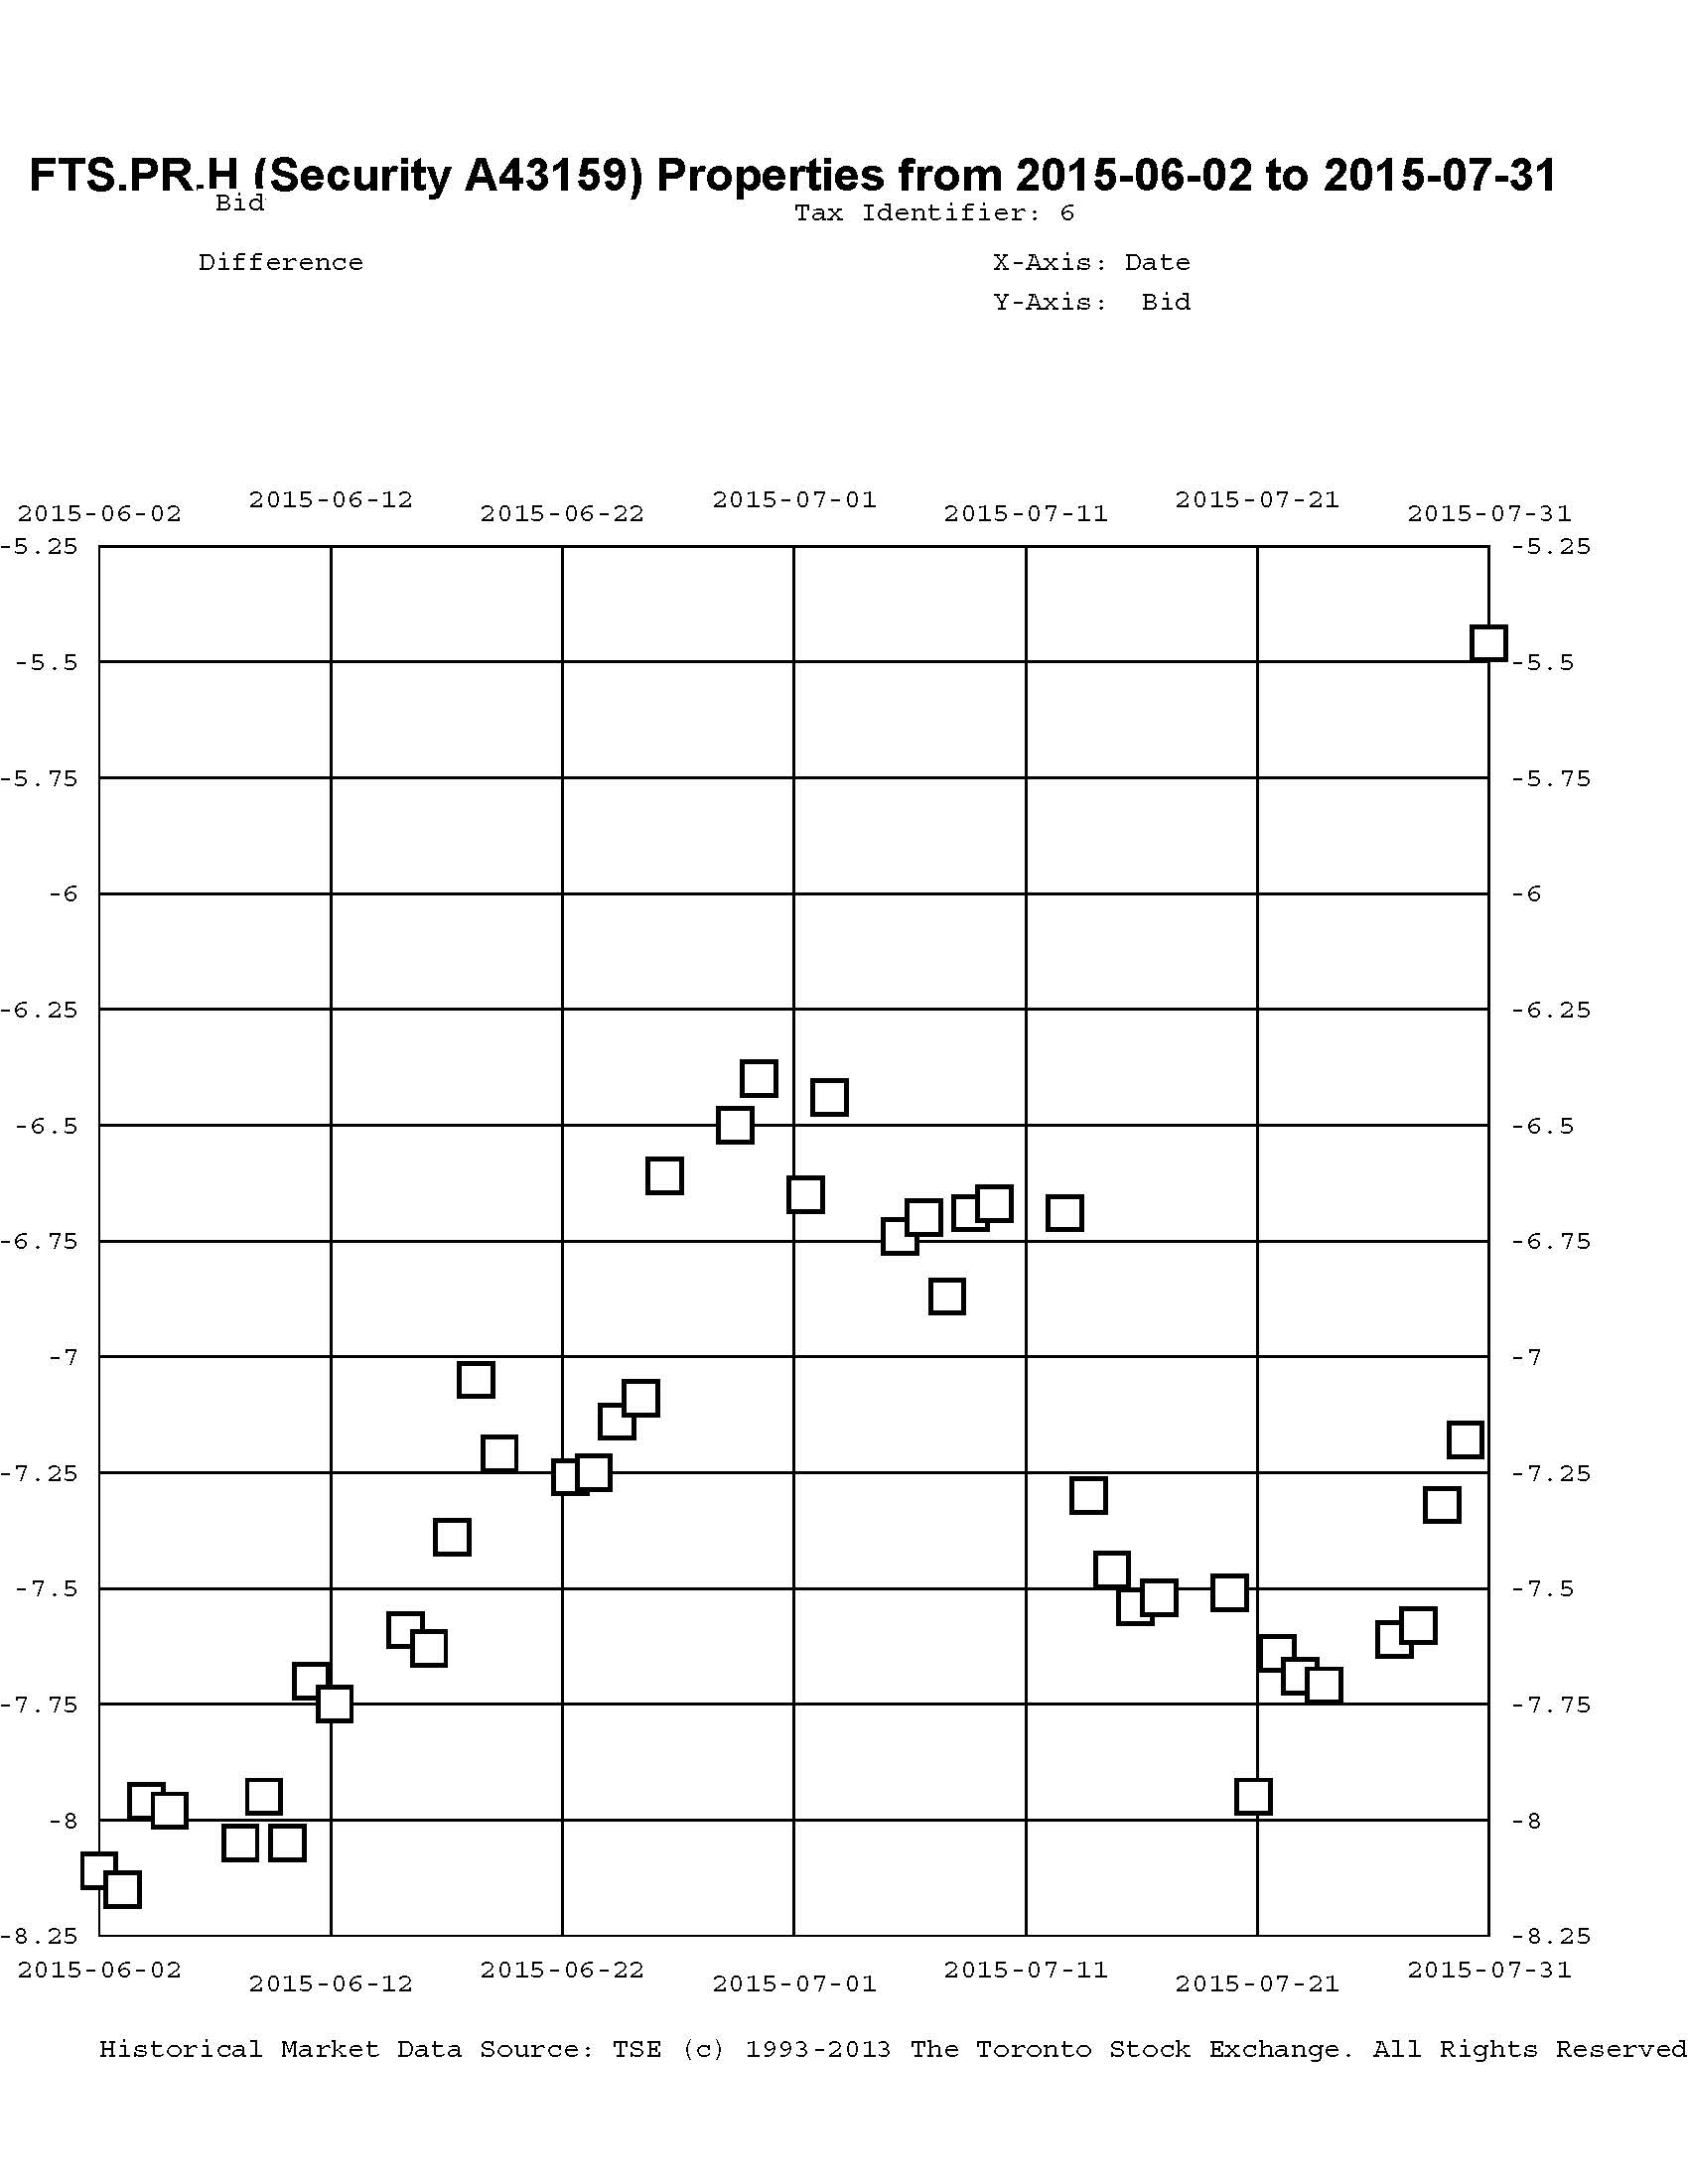
… and FTS.PR.H / FTS.PR.J:
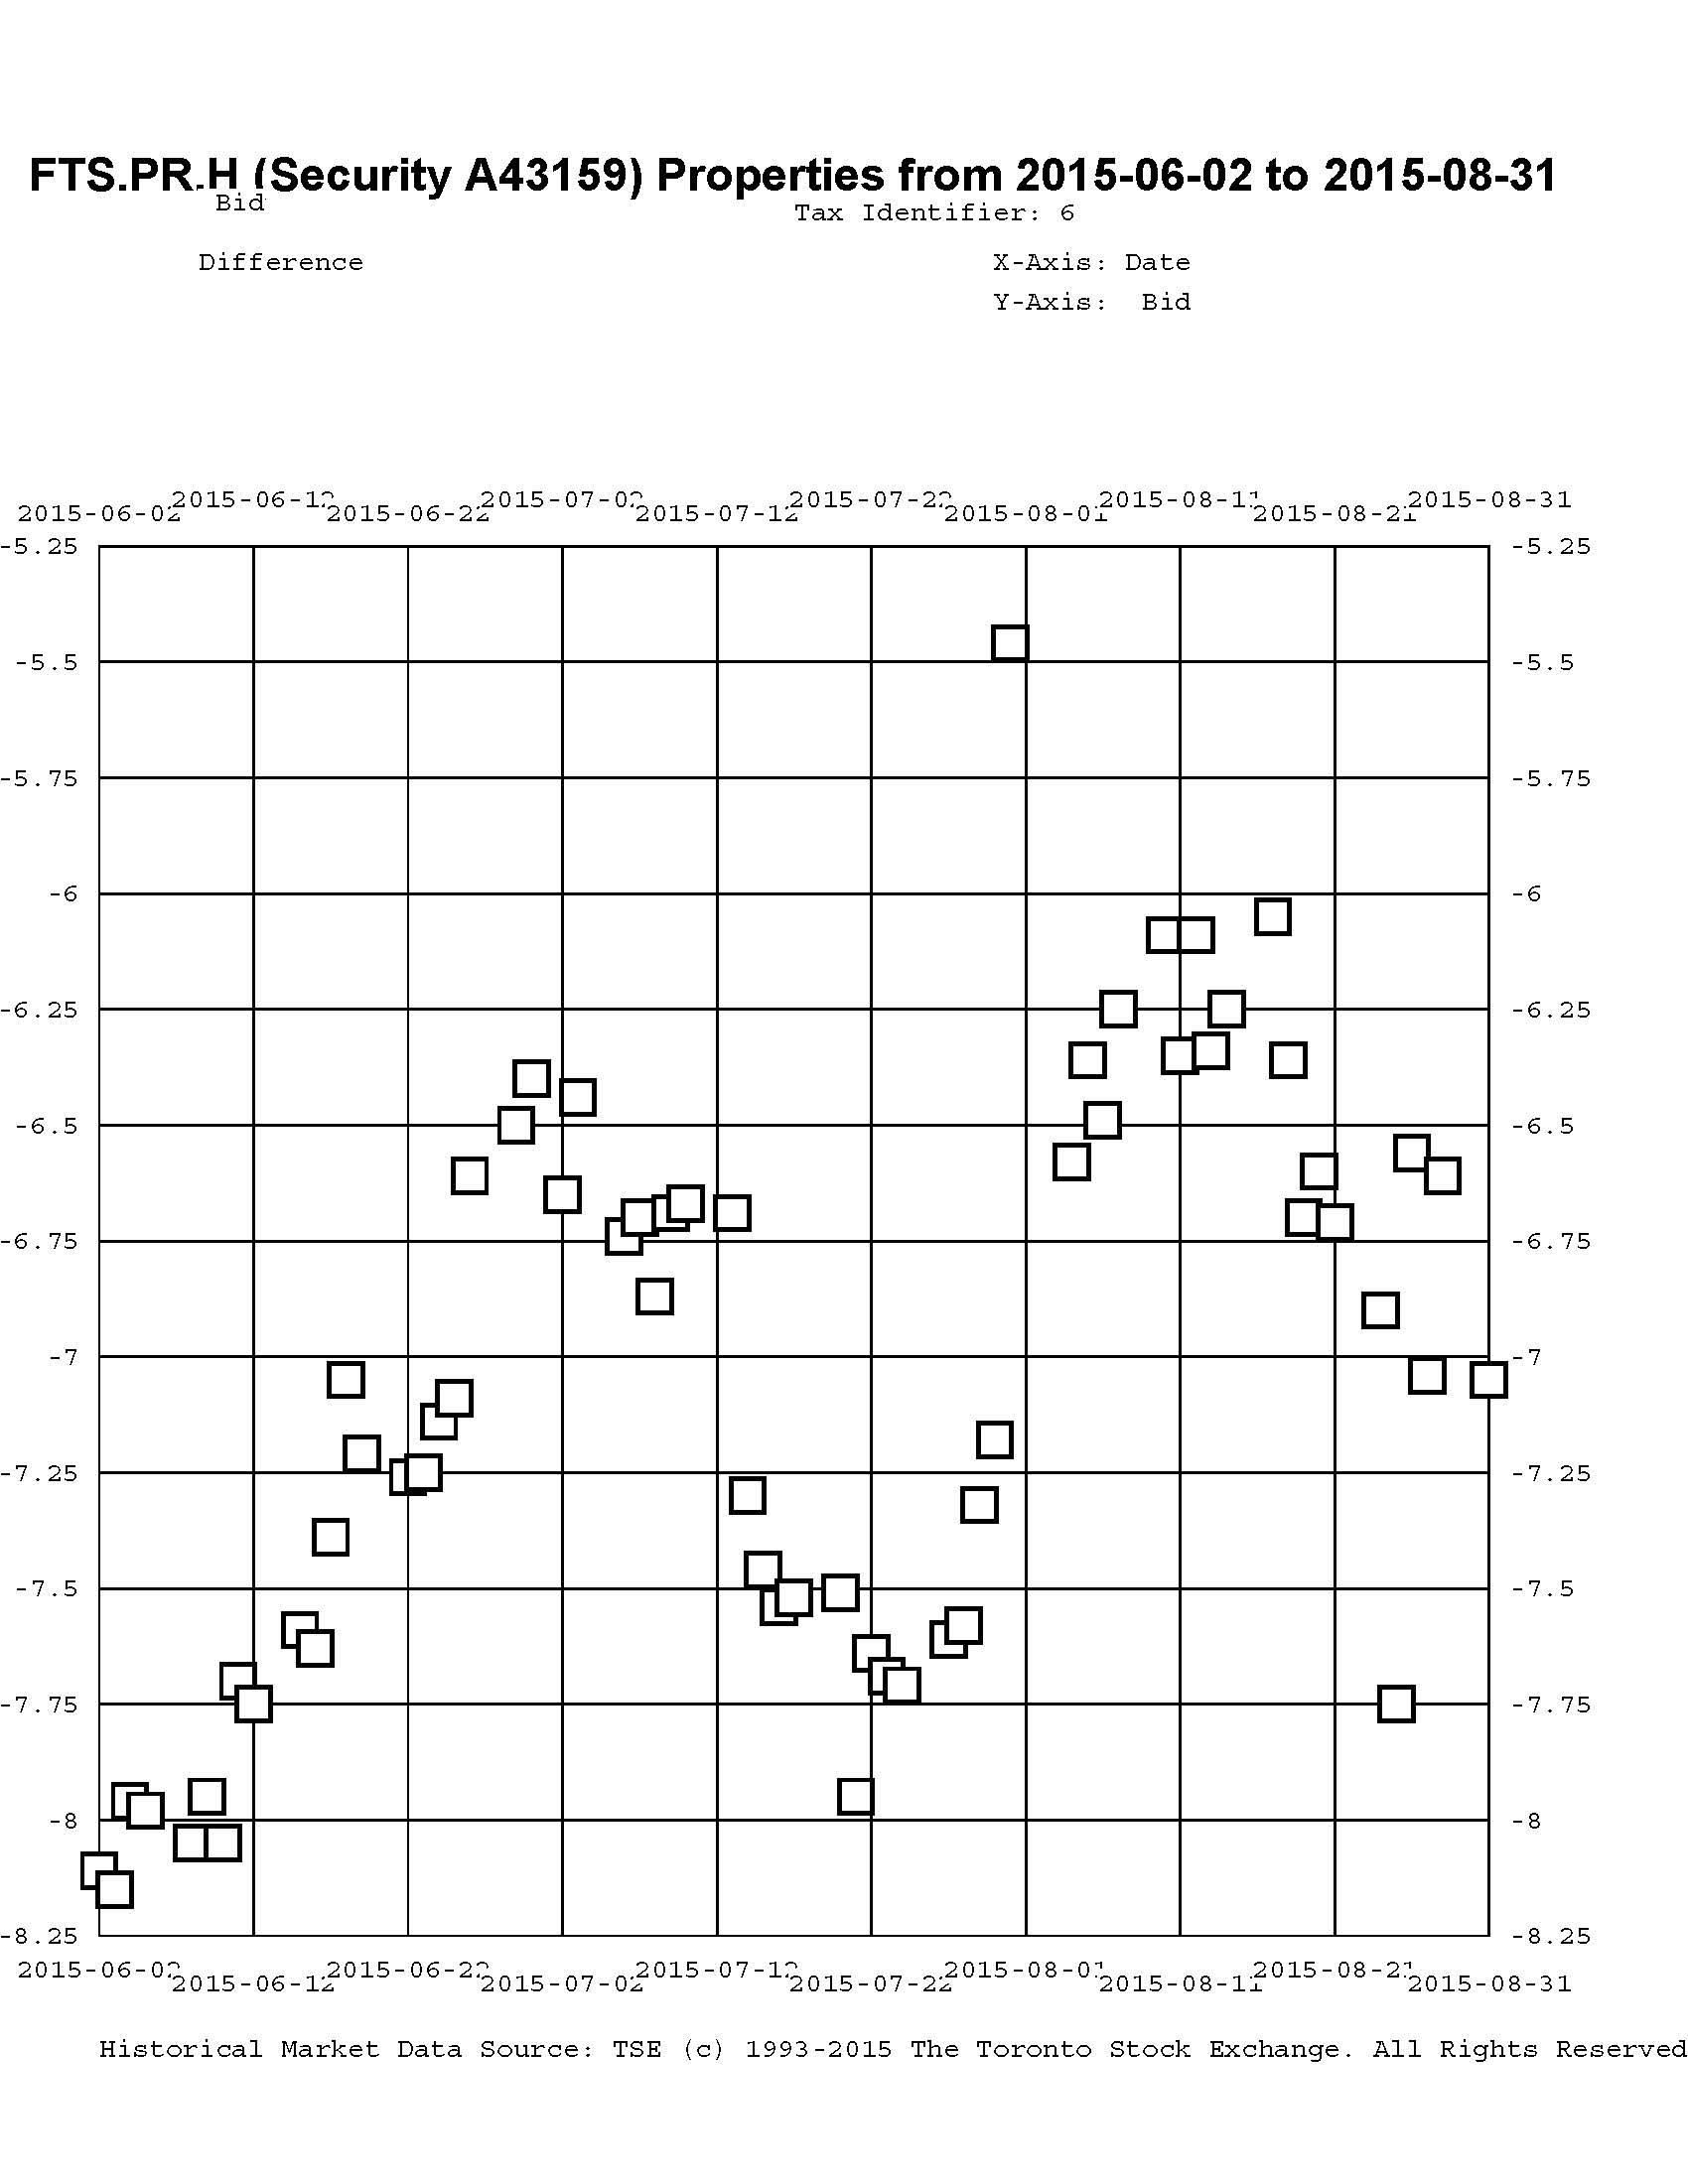
Click for Big
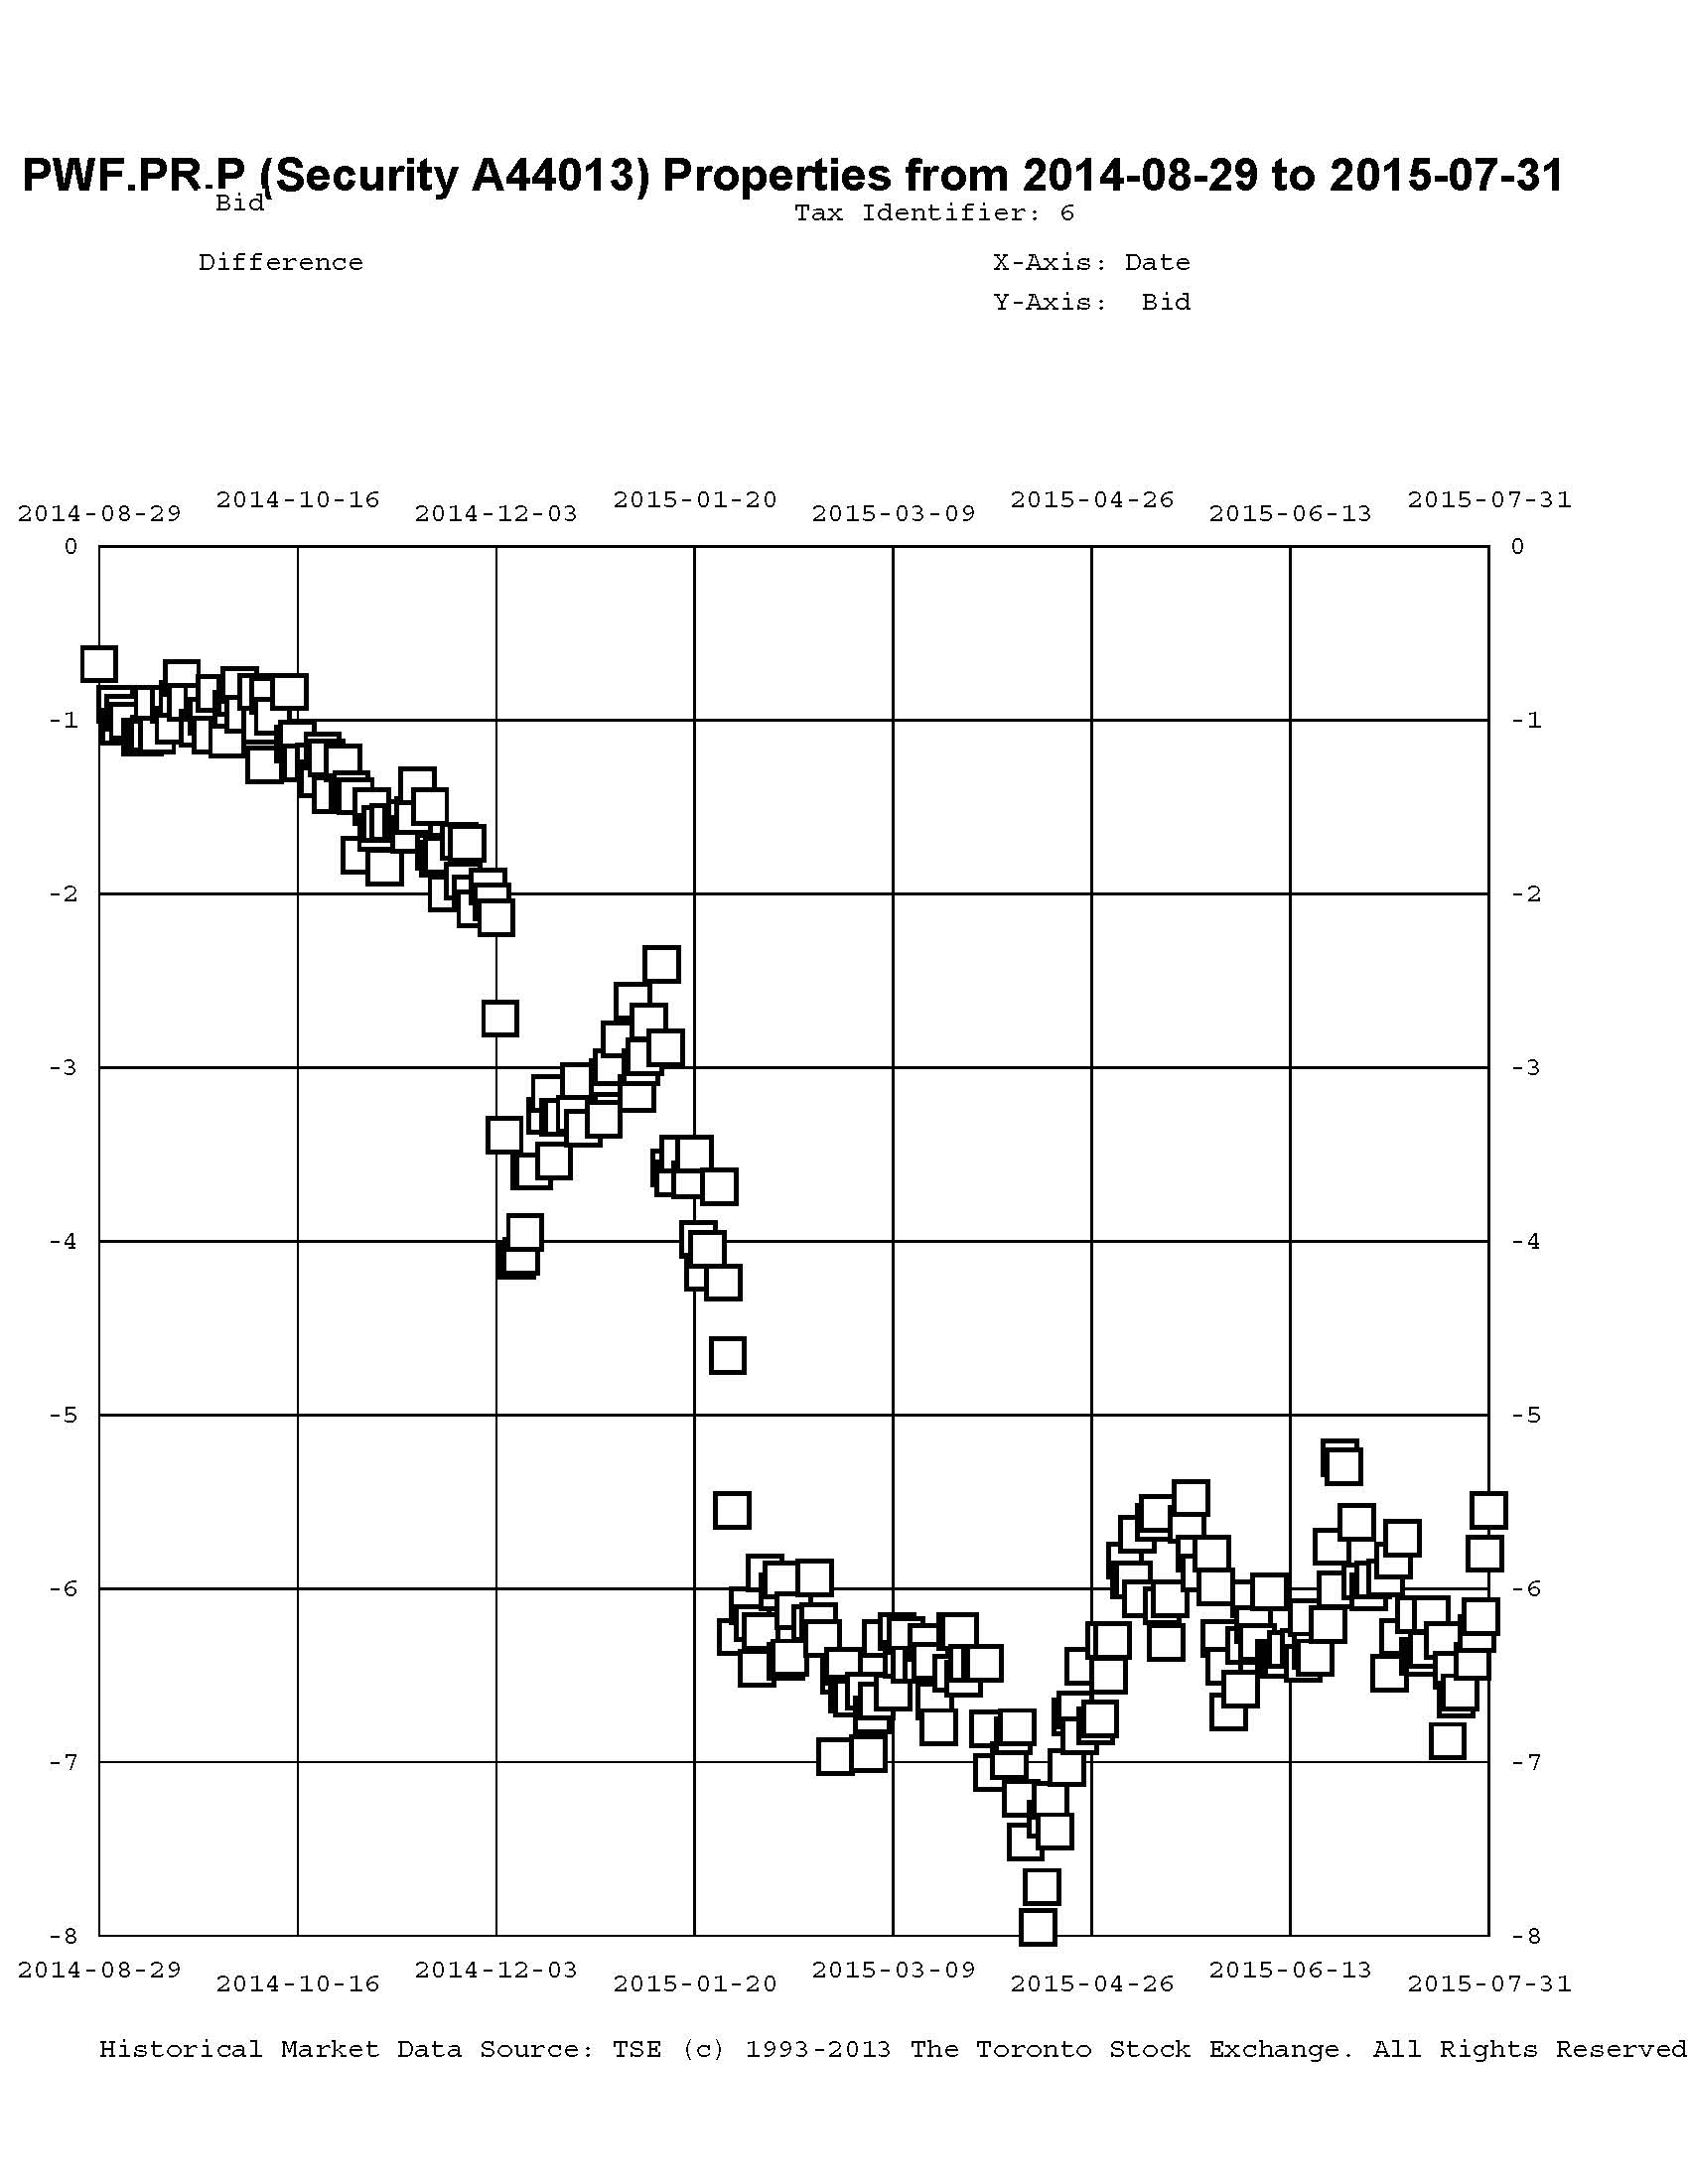
… and PWF.PR.P / PWF.PR.S:
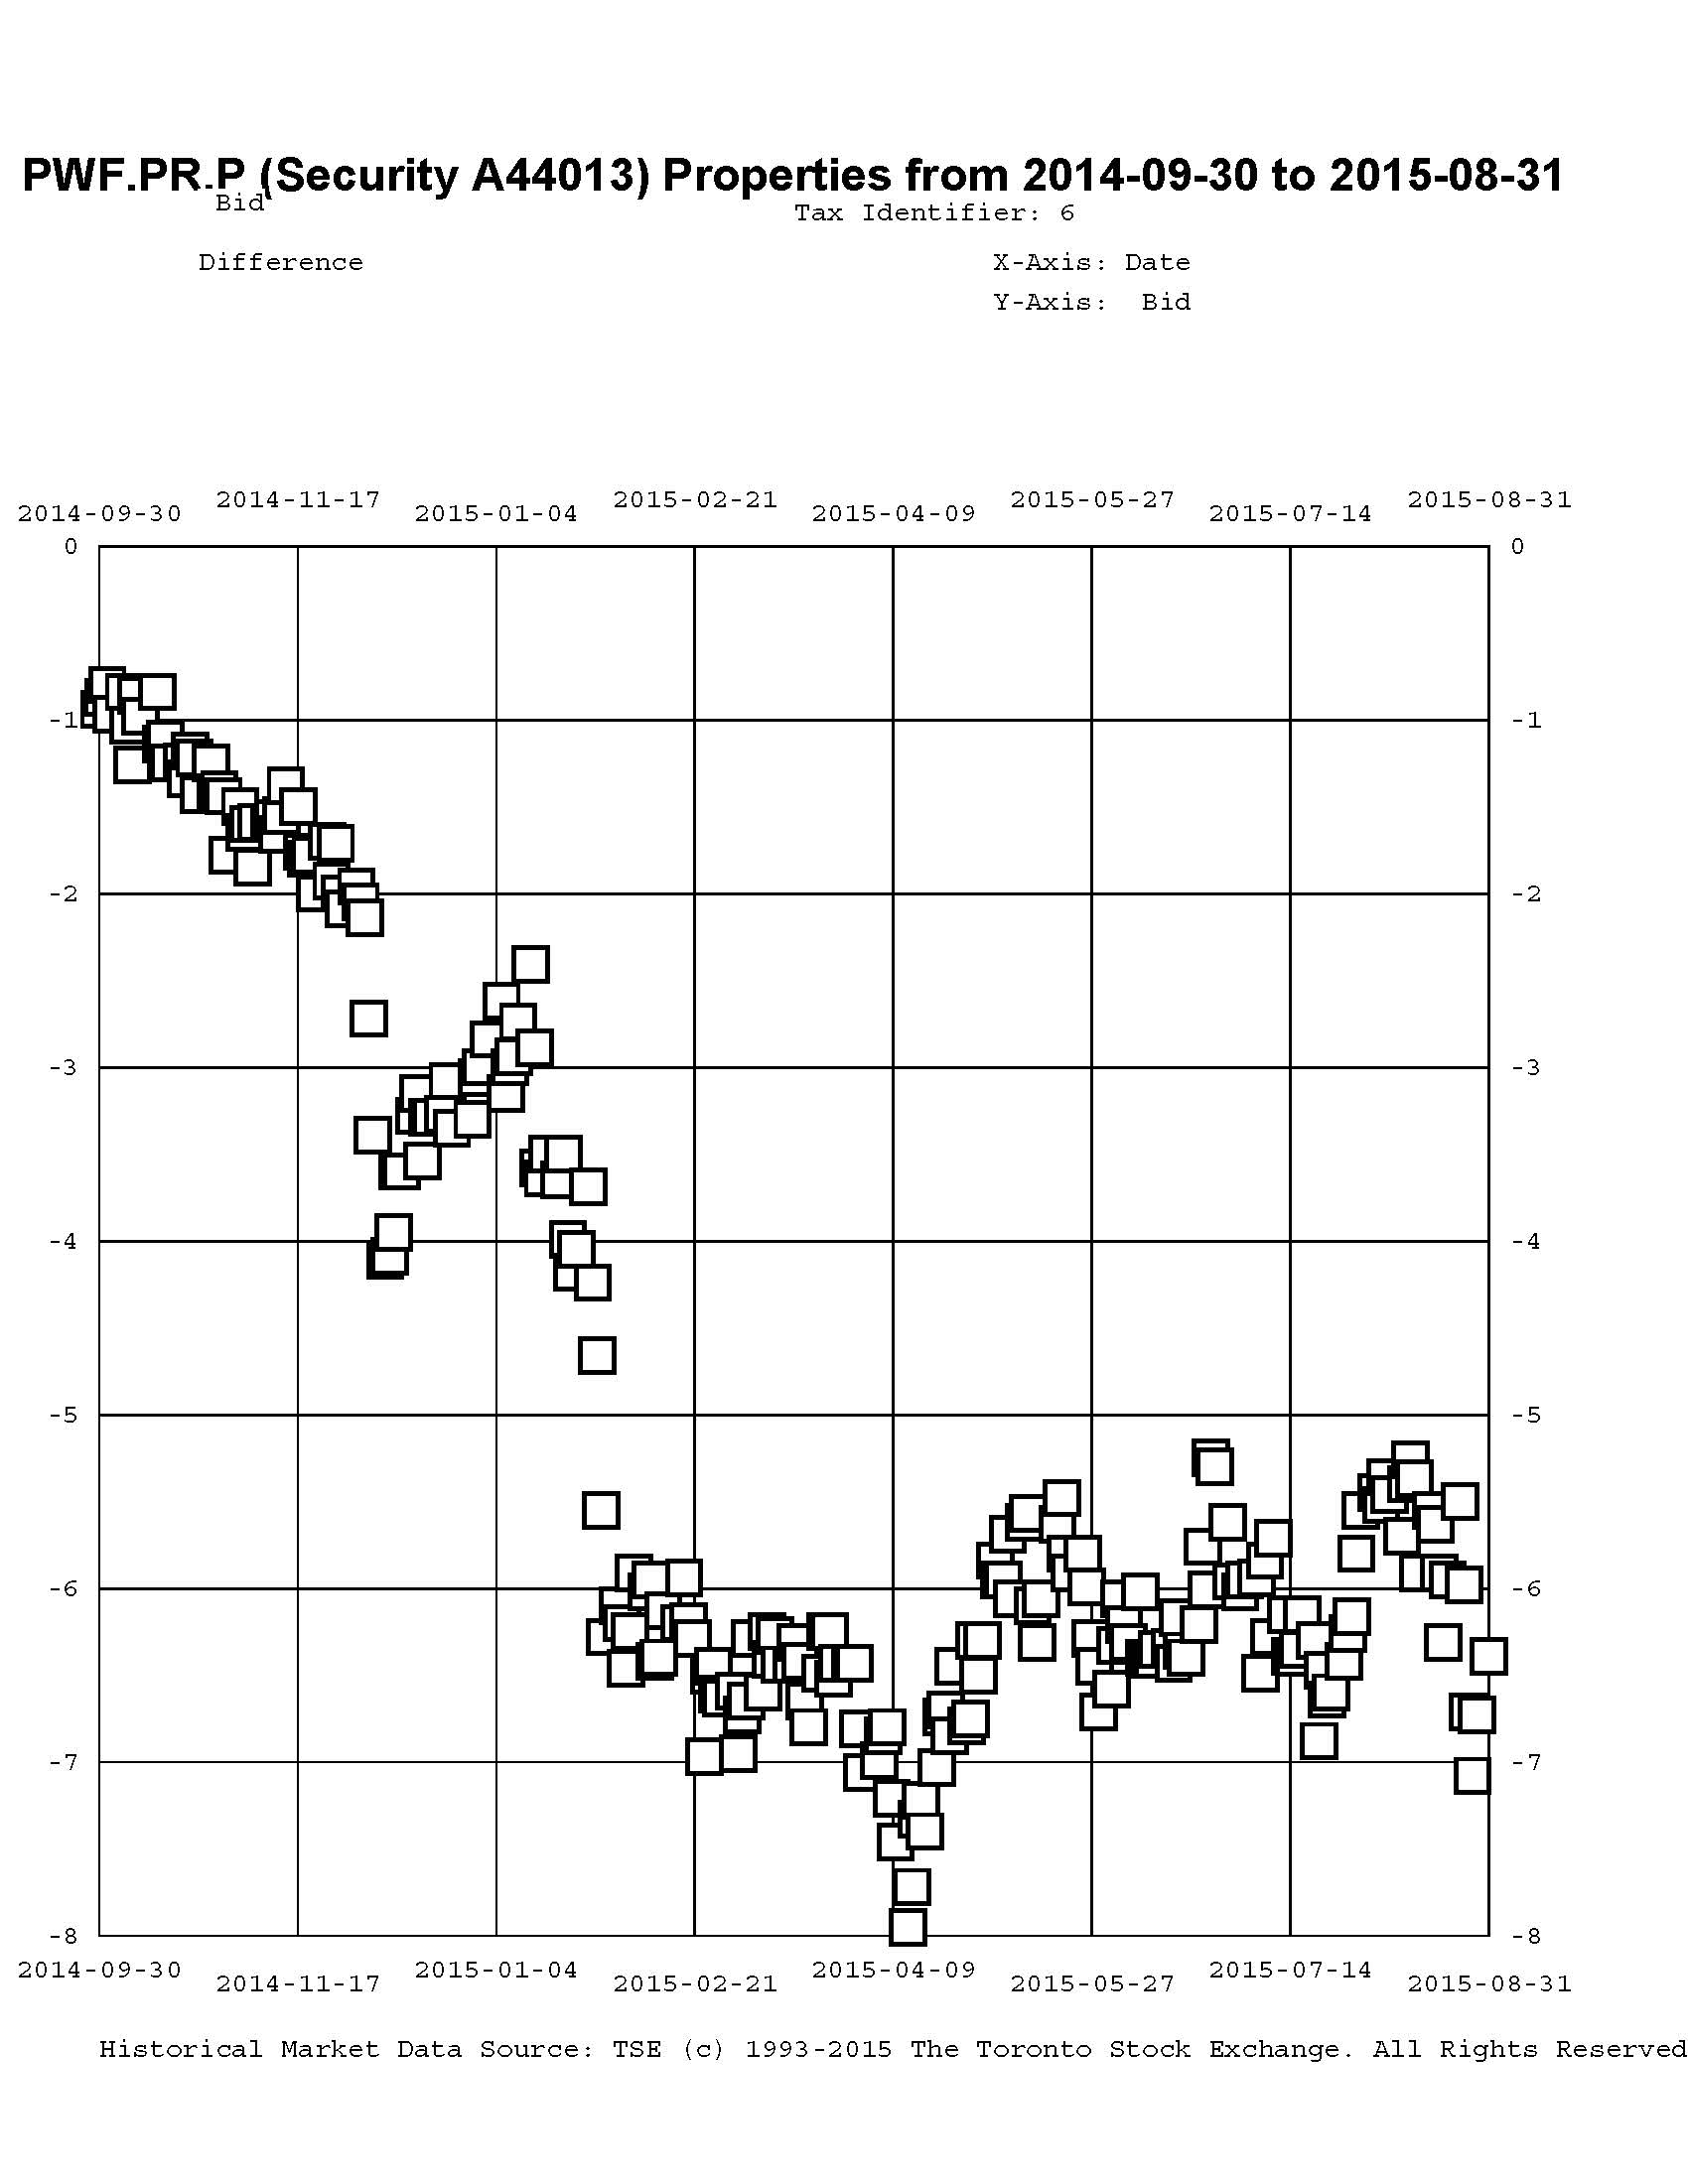
Click for Big
I will agree that the fund’s trades highlighted in this post may be decried as cases of monumental bad timing, but I should point out that in May, 2014, the fund was 63.9% Straight / 9.5% FixedReset while in May 2015 the fund was 12% Straight / 86% FixedReset, FloatingReset and FixedFloater (The latter figures include allocations from those usually grouped as ‘Scraps’). Given that the indices are roughly 30% Straight / 60% FixedReset & FloatingReset, it is apparent that the fund was extremely overweighted in Straights / underweighted in FixedResets in May 2014 but this situation has now reversed. HIMIPref™ analytics have been heavily favouring low-spread issues and the fund’s holdings are overwhelmingly of this type.
Summarizing the charts above in tabular form, we see:
| FixedReset | Straight | Take-out December 2013 |
Take-out MAPF Trade |
Take-out December 2014 |
July 2015 | August 2015 |
| GWO.PR.N 3.65%+130 |
GWO.PR.I 4.5% |
($0.04) | $1.00 | $2.95 | 5.70 | 6.85 |
| SLF.PR.G 4.35%+141 |
SLF.PR.D 4.45% |
($1.29) | $0.25 | $2.16 | 5.01 | 4.28 |
| MFC.PR.F 4.20%+141 |
MFC.PR.C 4.50% |
($1.29) | $0.86 | $1.20 | 4.46 | 4.88 |
| BAM.PR.X 4.60%+180 |
BAM.PR.N 4.75% |
($2.06) | $0.17 | 4.73 | 5.80 | |
| FTS.PR.H 4.25%+145 |
FTS.PR.J 4.75% |
$0.60 | $5.68 | 5.46 | 7.05 | |
| PWF.PR.P 4.40%+160 |
PWF.PR.S 4.80% |
($0.67) | $3.00 | 5.55 | 6.39 | |
| The ‘Take-Out’ is the bid price of the Straight less the bid price of the FixedReset; approximate execution prices are used for the “MAPF Trade” column. Bracketted figures in the ‘Take-Out’ columns indicate a ‘Pay-Up’ | ||||||
Changes were varied from July month-end to August month-end.
In January, a slow decline due to fears of deflation got worse with Canada yields plummeting after the Bank of Canada rate cut with speculation rife about future cuts although this slowly died away.
And in late March / early April it got worse again, with one commenter attributing at least some of the blame to the John Heinzl piece in which I pointed out the expected reduction in dividend payouts! In May, a rise in the markets in the first half of the month was promptly followed by a slow decline in the latter half; perhaps due to increased fears that a lousy Canadian economy will delay a Canadian tightening. Changes in June varied as the markets were in an overall decline.
In August we saw increased fear of global deflation emanating from China, although the ‘China Effect’ is disputed.
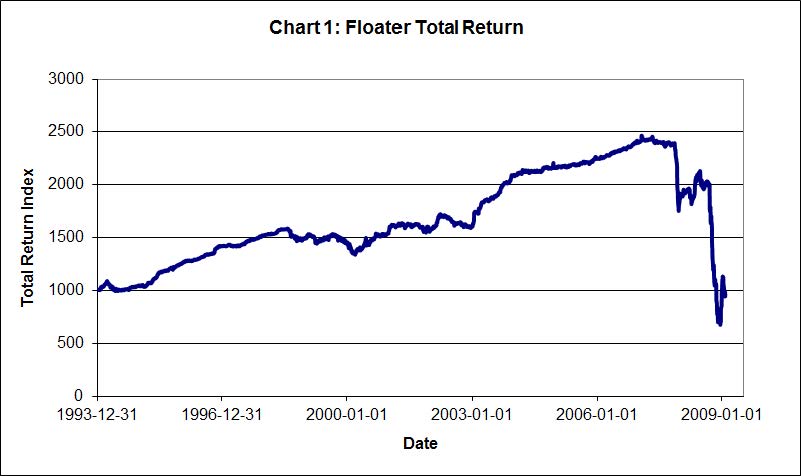
All in all, I take the view that we’ve seen this show before: during the Credit Crunch, Floaters got hit extremely badly (to the point at which their fifteen year total return was negative) because (as far as I can make out) their dividend rate was dropping (as it was linked to Prime) while the yields on other perpetual preferred instruments were skyrocketing (due to credit concerns). Thus, at least some investors insisted on getting long term corporate yields from rates based (indirectly and with a lag, in the case of FixedResets) on short-term government policy rates. And it’s happening again!
There is further discussion of the extremely poor YTD performance of FixedResets in the post eMail to a Client.
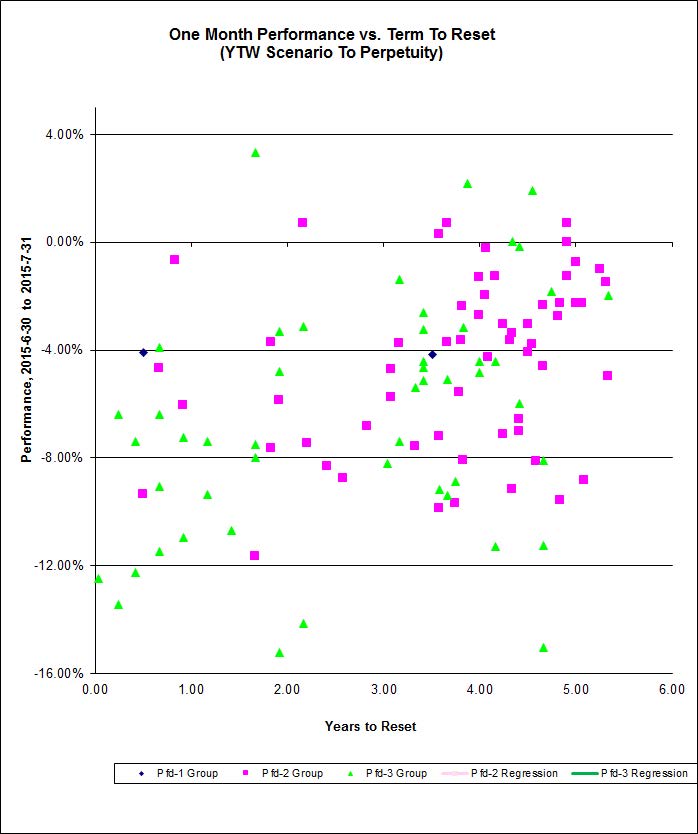
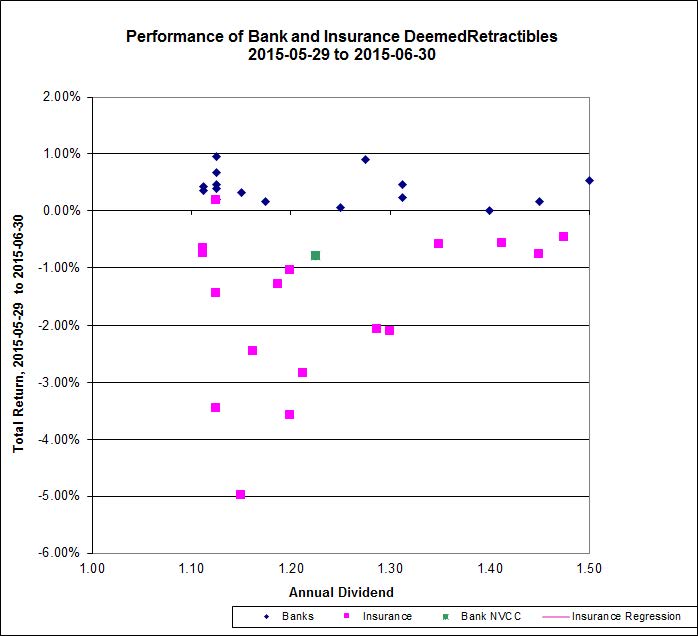
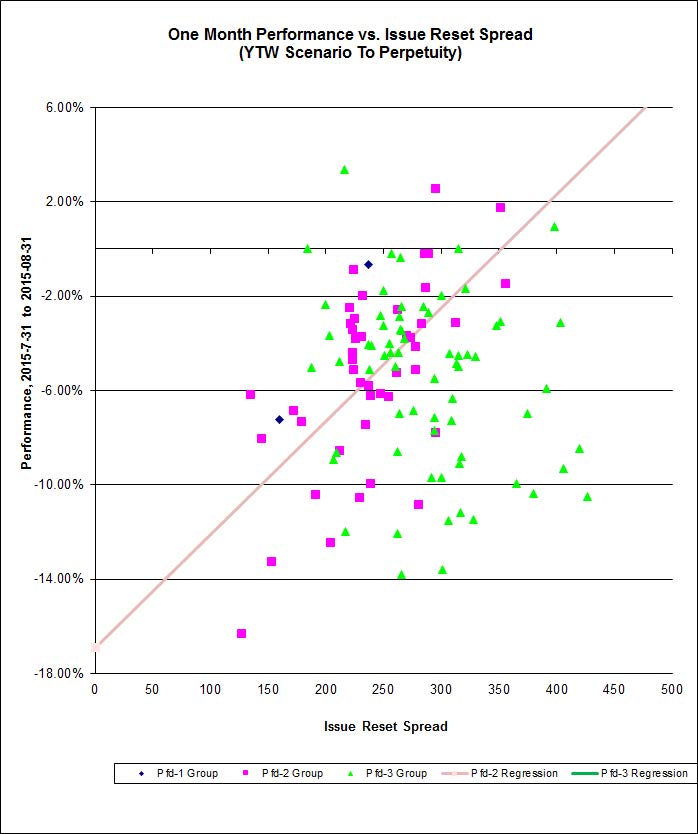
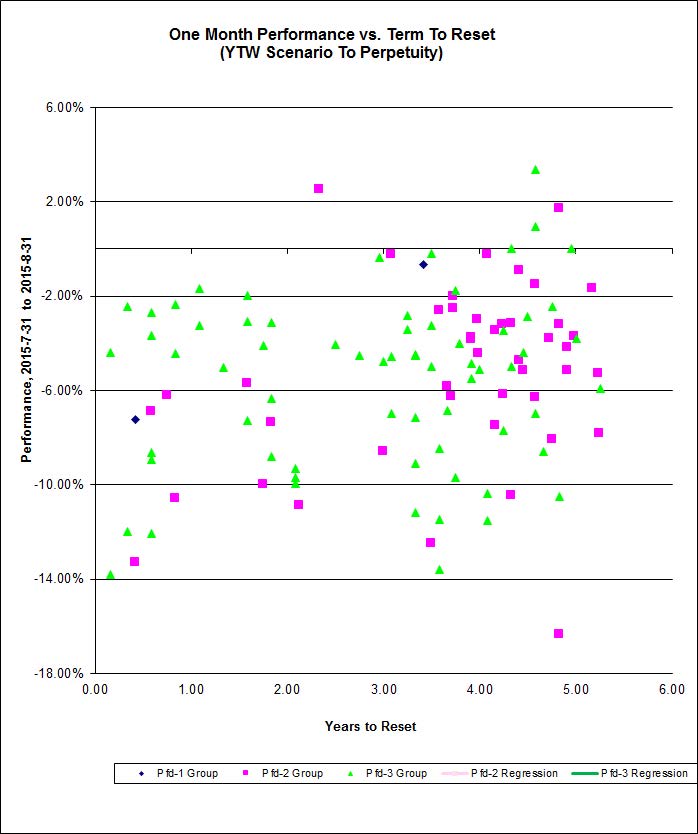
Here’s the August performance for FixedResets that had a YTW Scenario of ‘To Perptuity’ at mid-month.:
Click for Big
The market continues to be rather disorderly, but correlations between Issue Reset Spread and monthly performance for the “Pfd-2 Group” for August improved to 37% while the “Pfd-3 Group” correlation is a mere 4%. However, the correlation for returns against term to reset are still lousy at 8% and 0% for Pfd-2 and Pfd-3 issues respectively.
Click for Big