The Bank of Canada has announced it has:
The Bank of Canada today reduced its target for the overnight rate by 25 basis points to 2.5%, with the Bank Rate at 2.75% and the deposit rate at 2.45%.
After remaining resilient to sharply higher US tariffs and ongoing uncertainty, global economic growth is showing signs of slowing. In the United States, business investment has been strong but consumers are cautious and employment gains have slowed. US inflation has picked up in recent months as businesses appear to be passing on some tariff costs to consumer prices. Growth in the euro area has moderated as US tariffs affect trade. China’s economy held up in the first half of the year but growth appears to be softening as investment weakens. Global oil prices are close to their levels assumed in the July Monetary Policy Report (MPR). Financial conditions have eased further, with higher equity prices and lower bond yields. Canada’s exchange rate has been stable relative to the US dollar.
Canada’s GDP declined by about 1½% in the second quarter, as expected, with tariffs and trade uncertainty weighing heavily on economic activity. Exports fell by 27% in the second quarter, a sharp reversal from first-quarter gains when companies were rushing orders to get ahead of tariffs. Business investment also declined in the second quarter. Consumption and housing activity both grew at a healthy pace. In the months ahead, slow population growth and the weakness in the labour market will likely weigh on household spending.
Employment has declined in the past two months since the Bank’s July MPR was published. Job losses have largely been concentrated in trade-sensitive sectors, while employment growth in the rest of the economy has slowed, reflecting weak hiring intentions. The unemployment rate has moved up since March, hitting 7.1% in August, and wage growth has continued to ease.
CPI inflation was 1.9% in August, the same as at the time of the July MPR. Excluding taxes, inflation was 2.4%. Preferred measures of core inflation have been around 3% in recent months, but on a monthly basis the upward momentum seen earlier this year has dissipated. A broader range of indicators, including alternative measures of core inflation and the distribution of price changes across CPI components, continue to suggest underlying inflation is running around 2½%. The federal government’s recent decision to remove most retaliatory tariffs on imported goods from the US will mean less upward pressure on the prices of these goods going forward.
With a weaker economy and less upside risk to inflation, Governing Council judged that a reduction in the policy rate was appropriate to better balance the risks. Looking ahead, the disruptive effects of shifts in trade will continue to add costs even as they weigh on economic activity. Governing Council is proceeding carefully, with particular attention to the risks and uncertainties. Governing Council will be assessing how exports evolve in the face of US tariffs and changing trade relationships; how much this spills over into business investment, employment, and household spending; how the cost effects of trade disruptions and reconfigured supply chains are passed on to consumer prices; and how inflation expectations evolve.
The Bank is focused on ensuring that Canadians continue to have confidence in price stability through this period of global upheaval. We will support economic growth while ensuring inflation remains well controlled.
Mark Rendell in the Globe comments:
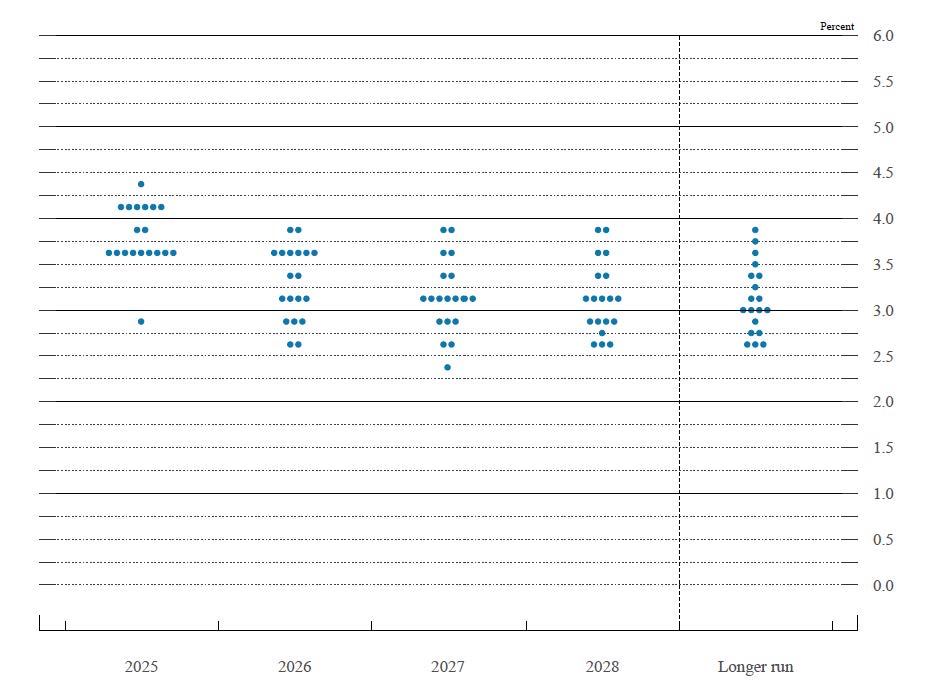
The Bank of Canada lowered its policy rate by a quarter-point to 2.5 per cent but refrained from providing guidance about additional rate cuts. Bank of Canada Governor Tiff Macklem said only that the bank would proceed “carefully” and “look over a shorter horizon than usual.”
…
Business investment is likewise weak. And while consumer spending has held up fairly well, Mr. Macklem warned that slow population growth and rising unemployment will likely weigh on household spending in the coming months.The BoC’s reluctance to lower interest rates through much of 2025 was based on concerns about sticky core inflation measures, which have remained stubbornly above the bank’s 2-per-cent target. It was also nervous that tariffs and supply-chain disruptions would add to inflation even as they hurt economic activity.
These worries appear to be fading. Although core inflation measures remain around 3 per cent, underlying inflation is running closer to 2.5 per cent, Mr. Macklem said, and “the upward pressures on underlying inflation have diminished.”
Prime Minister Mark Carney’s decision in August to drop retaliatory tariffs on more than $40-billion worth of U.S. goods – products that comply with continental free-trade agreement rules of origin – also means there will be less upward pressure on imported goods prices, Mr. Macklem said.
…while Darcy Keith reports:
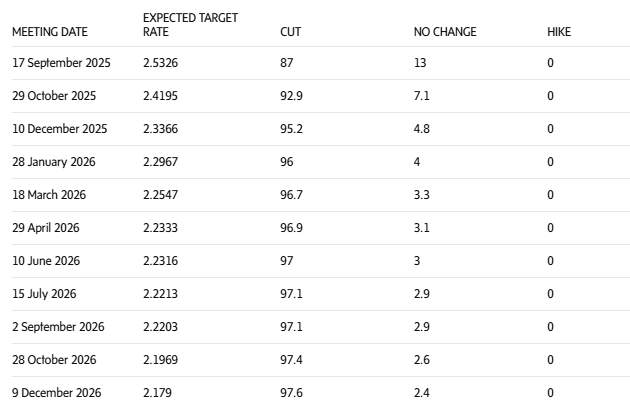
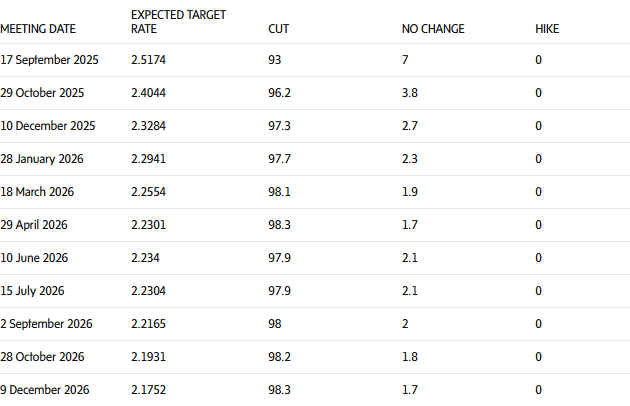
Money market traders grew a little more doubtful that October will bring another rate cut as the Bank of Canada news conference wore on and Governor Tiff Macklem made it clear the bank would not provide much forward guidance this time around on the trajectory of future rate moves.
Implied probabilities in overnight index swap markets now suggest a 40-per-cent probability of a rate cut at the bank’s next meeting, on Oct. 29, down from about 50 per cent when the rate decision was announced earlier today, according to LSEG data. There’s now about a 62-per-cent probability priced into markets of another rate cut coming before 2025 draws to a close.
So if Mr. Macklem is trying to temper further easing expectations, he’s finding some success.
Prime followed:
- TD : Down 0.25% to 4.70%
- CIBC: Down 0.25% to 4.70%
- BNS: Down 0.25% to 4.70%
- RBC: Down 0.25% to 4.70%
- BMO:Down 0.25% to 4.70%
Well, Rob Carrick and Ryan Siever will be mad – nothing on the way up and precious few hopes for the way down:
There’s a case to be made for banks giving borrowers a break when what is expected to be the biggest interest rate hike in 22 years is announced on Wednesday.
A brief flashback to 2015 is required to get the sense of this story. The economy back then was in the opposite shape of what it is now – weak enough to prompt the Bank of Canada to cut its trendsetting overnight rate by 0.25 of a percentage point in January and again in July.
The big banks hijacked part of that rate cut. While the overnight rate fell by a total 0.5 of a point, the banks cut their prime rate by cumulative 0.3 of a point. They held back the rest of the rate cut to build their revenues and profit.
There was a delay in reducing the prime when the Canada Overnight rate dropped 25bp to 0.75% in January 2015 and again when Canada Overnight dropped a further 25bp to 0.50% in July of that year.